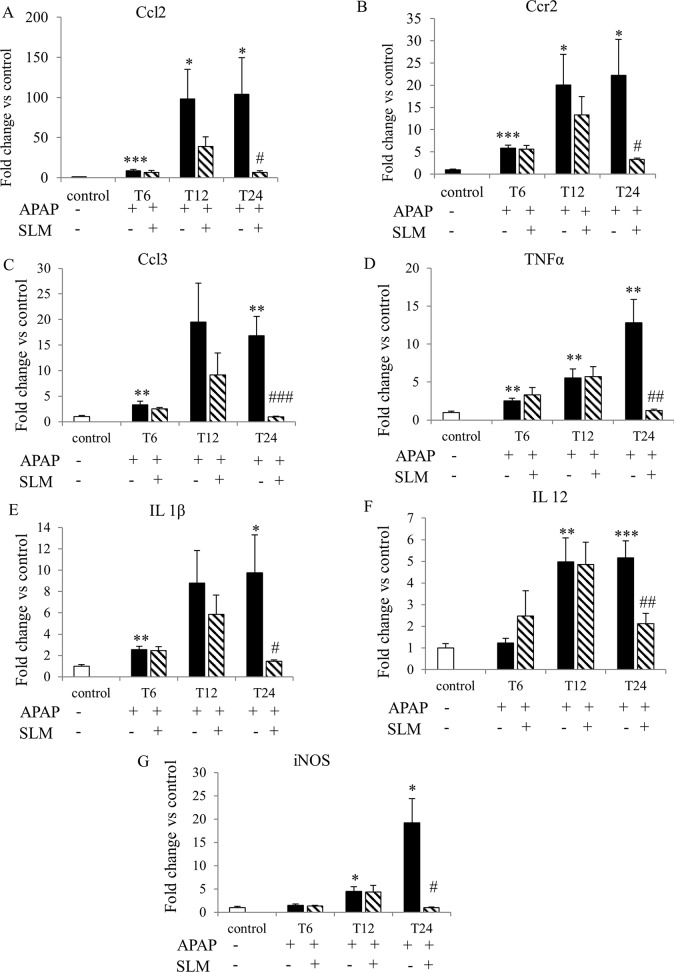
Fig 9. Effect of APAP and SLM on mRNA expression of selected inflammatory markers.
(A) Ccl2; (B) Ccr2; (C) Ccl3; (D) TNFα; (E) IL 1β; (F) IL 12; (G) iNOS. Data are expressed as a fold change related to the untreated (control) group. Values are given as a mean ± SEM, n = 7. *p < 0.05, **p < 0.01, ***p < 0.001 APAP vs control; #p < 0.05, ##p < 0.01, ###p < 0.001 APAP+SLM vs APAP.

