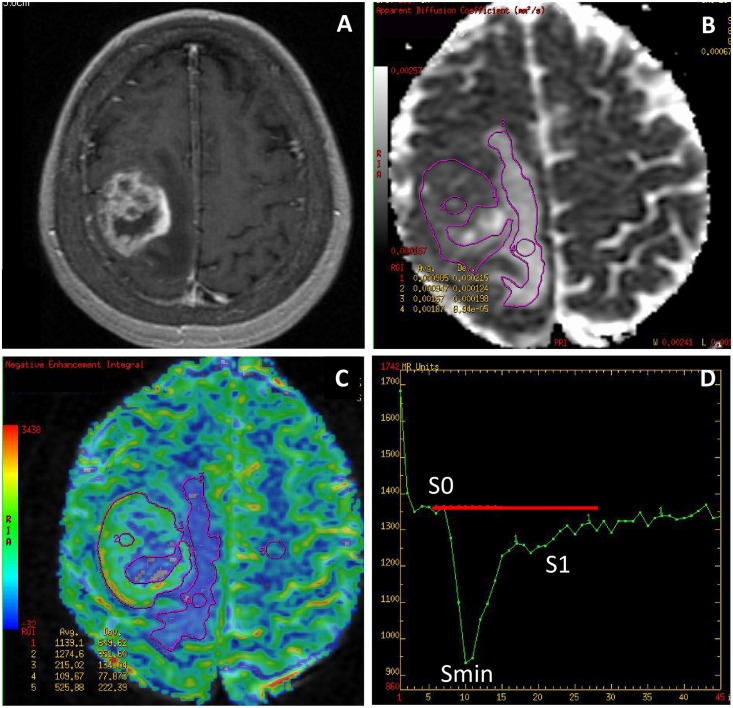
Fig 1. Glioblastoma multiforme (GBM).
(A) a post-contrast T1-weighted image, (B) an ADC map, (C) a CBV map, (D) a perfusion signal intensity time curve. The ADC (B) and CBV (C) maps show placement of large irregular freehand ROIs within the tumor core and the peritumoral edema as well as small circular ROIs within the big ROIs and in the contralateral normal white matter used as a reference ROI. The perfusion curve (D) shows hemodynamics of contrast agent during the first pass of a bolus through the brain vasculature with an x-axis reflecting time in seconds and y-axis indicating signal intensity. Red transverse line is a baseline.

