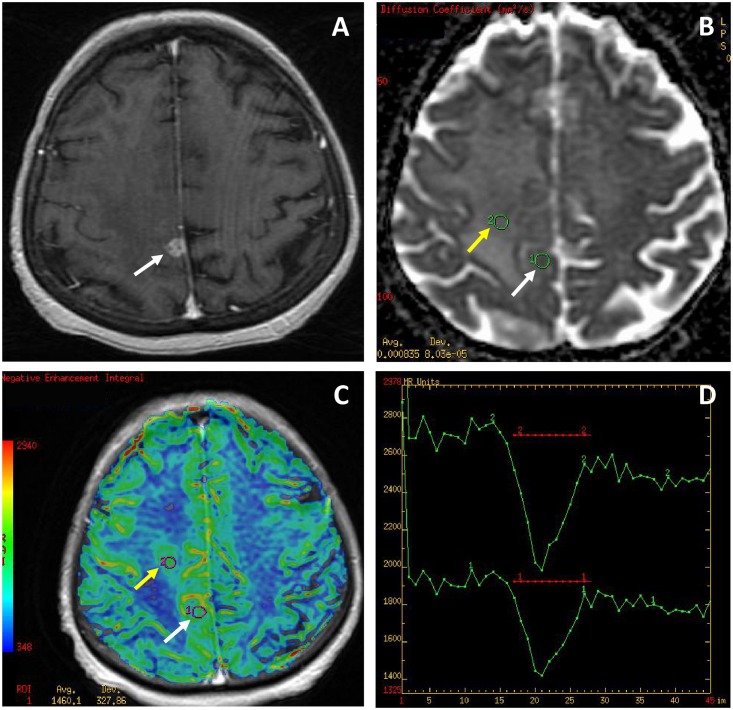
Fig 2. Glioblastoma multiforme (GBM).
(A) a post-contrast T1-weighted image, (B) an ADC map, (C) a CBV map, (D) perfusion signal intensity time curves. The tumor appears as a small enhancing lesion (white arrows) with a large non-enhancing peritumoral zone mimicking a metastasis. The ADC map (B) shows minimal ADC values similar to normal white matter (0.83 x 10⁻³ mm2/s within the tumor core and 0.78 x 10⁻³ mm2/s within the peritumoral region of infiltration). The CBV map (C) shows the hyperperfused tumor core (white arrow, max rCBV = 2.9) and a large area of increased perfusion (yellow arrow, max rCBV = 2.25) within the peritumoral zone indicating neoplastic infiltration which is a feature differentiating GBM from a metastasis surrounded exclusively by a pure vasogenic edema. The perfusion curves (D) present only partial return to the baseline (red transverse line) in both the tumor core (lower curve) and the area of neoplastic infiltration (upper curve).

