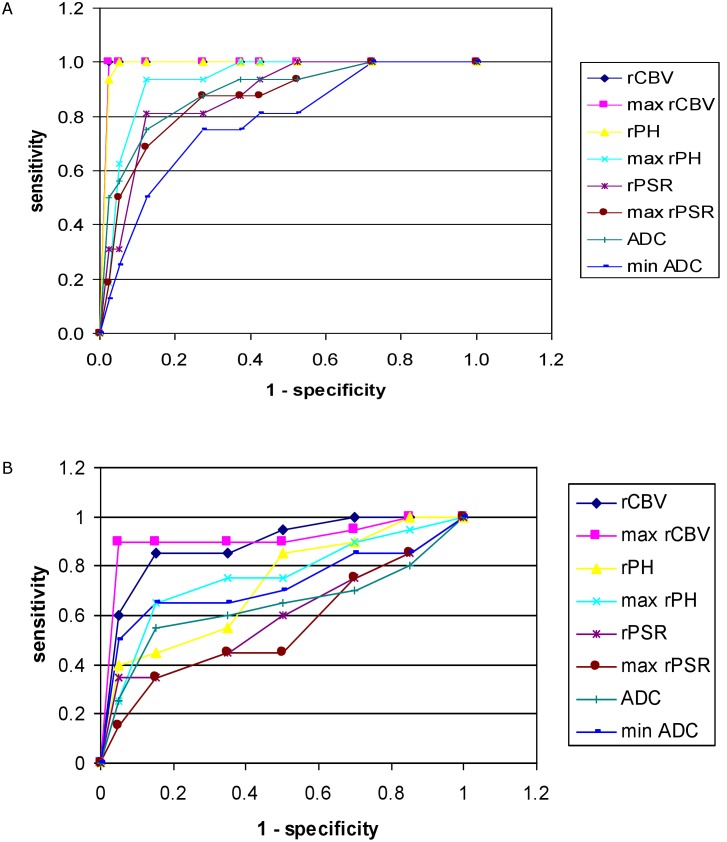
Fig 5. Receiver operating characteristic (ROC) curve.
ROC analysis for comparisons of perfusion and diffusion parameters from the tumor core (A) which are used for differentiation of PCNSLs from GBMs and metastases as well as from the peritumoral zone (B) used for differentiation of GBMs from metastases. Both graphs A and B show the highest accuracy (the largest area under the curve) for the values of max rCBV.

