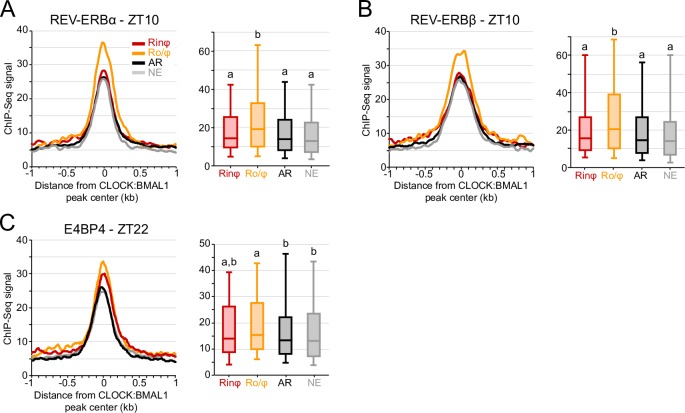
Fig 2. REV-ERBα and REV-ERBβ ChIP-Seq signal is higher at CLOCK:BMAL1 DNA binding sites targeting genes transcribed at night.
A-C (Left). Average ChIP-Seq signal for REV-ERBα (A), REV-ERBβ (B) and E4BP4 (C) at CLOCK:BMAL1 DNA binding sites (center ± 1kb) for each of the 4 CLOCK:BMAL1 transcriptional output group. A-C (Right). Distribution of REV-ERBα (A), REV-ERBβ (B) and E4BP4 (C) ChIP-Seq signal at CLOCK:BMAL1 peaks for each of the 4 CLOCK:BMAL1 transcriptional output groups (signal for each peak was averaged at CLOCK:BMAL1 peak center ± 250bp). Groups are labeled as in Fig 1. Those with different letters are significantly different (Kruskal-Wallis test; p < 0.05). REV-ERBα and REV-ERBβ ChIP were performed from mice liver collected at ZT10, while E4BP4 ChIP was performed from mice liver collected at ZT22. ChIP-Seq datasets were retrieved from Cho et al., 2012 [35], and E4BP4 ChIP-Seq datasets from Fang et al., 2014 [36].

