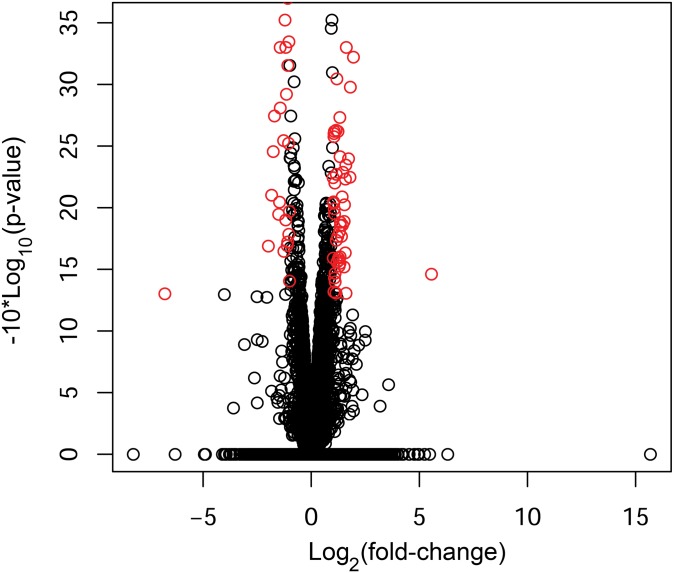
Fig 1. Expression differences between patients with IAs and controls, and an IA-associated expression signature.
The volcano plot demonstrates differential RNA expression between the two groups. Red circles indicate an IA-associated signature of significantly differentially expressed transcripts (p<0.05) with an absolute fold-change≥2.

