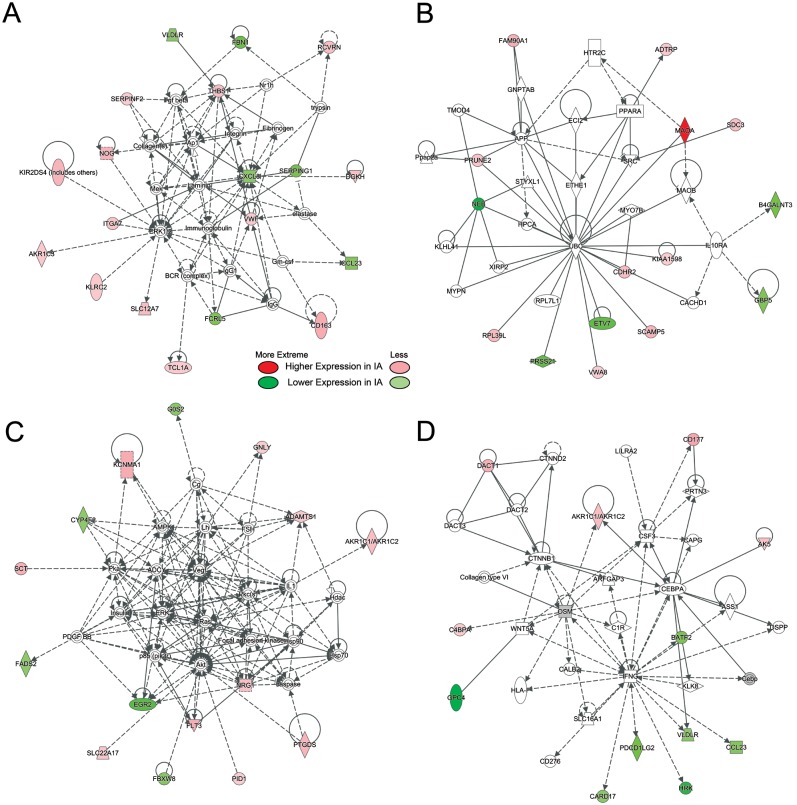
Fig 4. The 4 most regulated networks.
Networks were derived from IPA of differentially expressed transcripts (p<0.05) in neutrophils from IA patients and controls. Transcripts with increased expression levels in patients with IAs are red; transcripts with lower expression levels in patients with IAs are green; and fold-change is represented by intensity. Non-differentially expressed transcripts with known interactions are not colored. (A) This network (p-score = 41) shows regulation of transcripts with increased expression by an ERK1/2 and AP1. IL8, regulates transcripts with lower expression in samples from patients with IAs. (B) This network (p-score = 30) shows regulation of transcripts by UBC. (C) This network (p-score = 30) shows two nodes of regulation at AKT and VEGF. (D) This network (p-score = 23) shows regulation of transcripts with lower expression in IA samples by IFNG.

