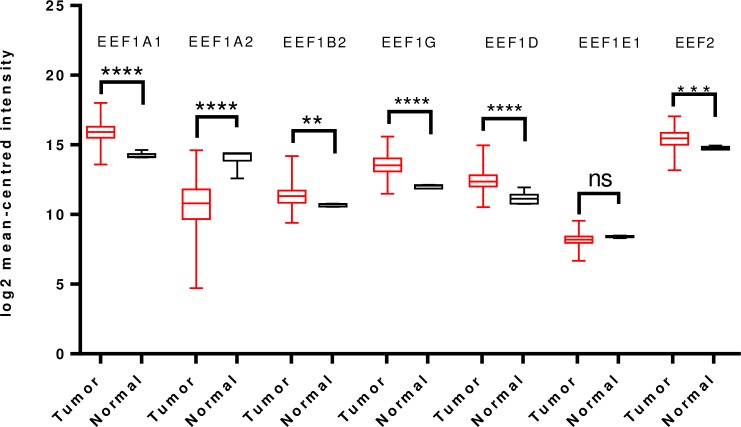
Fig 5. Analysis of mRNA expression levels of elongation factors in glioblastoma and gliomas using TCGA mRNA HiSeq expression data.
Box-whisker plots indicate the differences in transcript levels of each elongation factor, between normal and tumor samples. The median value is represented by the middle line in the boxes. Statistical differences were ascertained by two-tailed Student’s t-test using graph-pad prism software. ****p ≤ 0.0001, ***p ≤ 0.001, ** p ≤ 0.01, ns–non significant.

