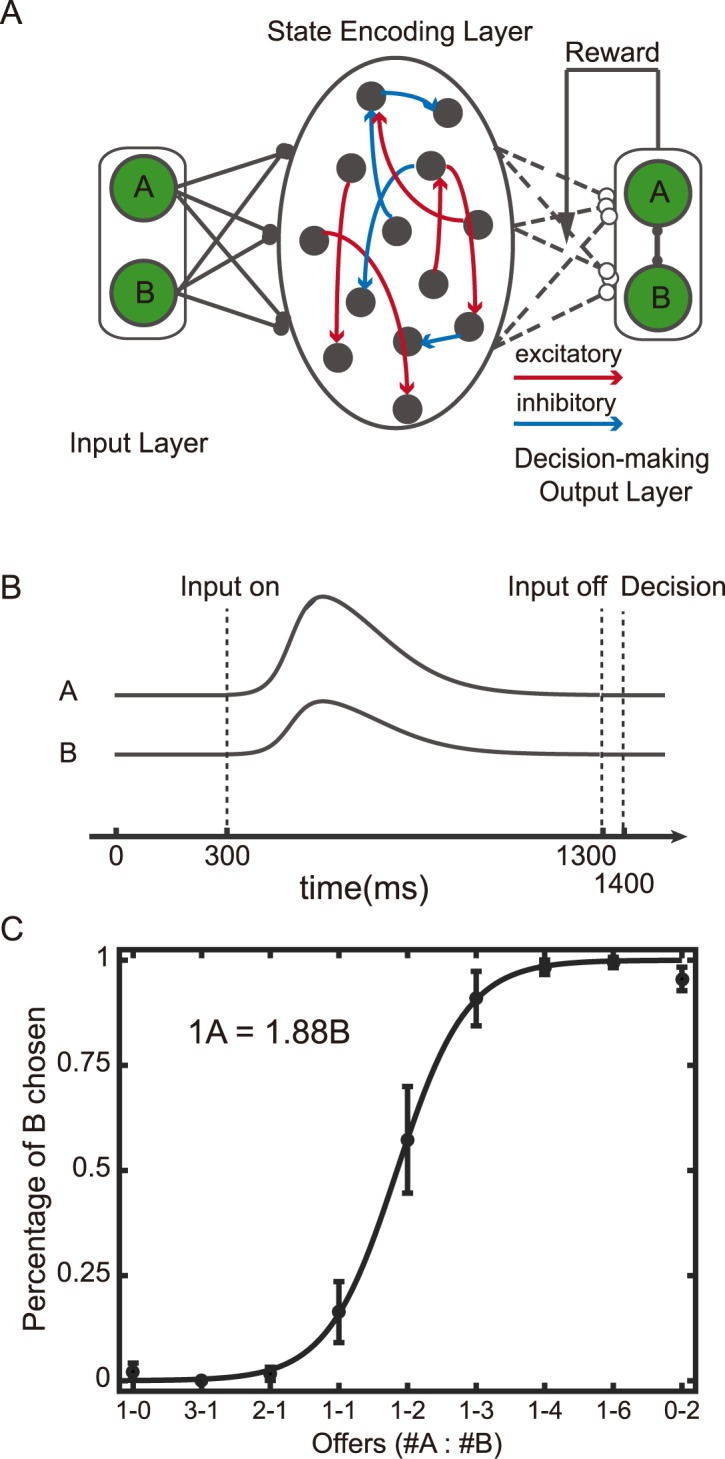
Fig 5. Value-based decision-making task.

A. The schematic diagram of the model. B. The event sequence. The stimuli are presented between 300 ms and 1300 ms after the trial onset. The decision is computed with the neural activity at 1400 ms after the trial onset. The input neurons’ activity profiles mimic those of real neurons (see Methods). C. Choice pattern. The relative value preference calculated based on the network behavior is indicated on the top left, and the actual relative value preference used in the simulation is 1A = 2B.
