Figure 4.

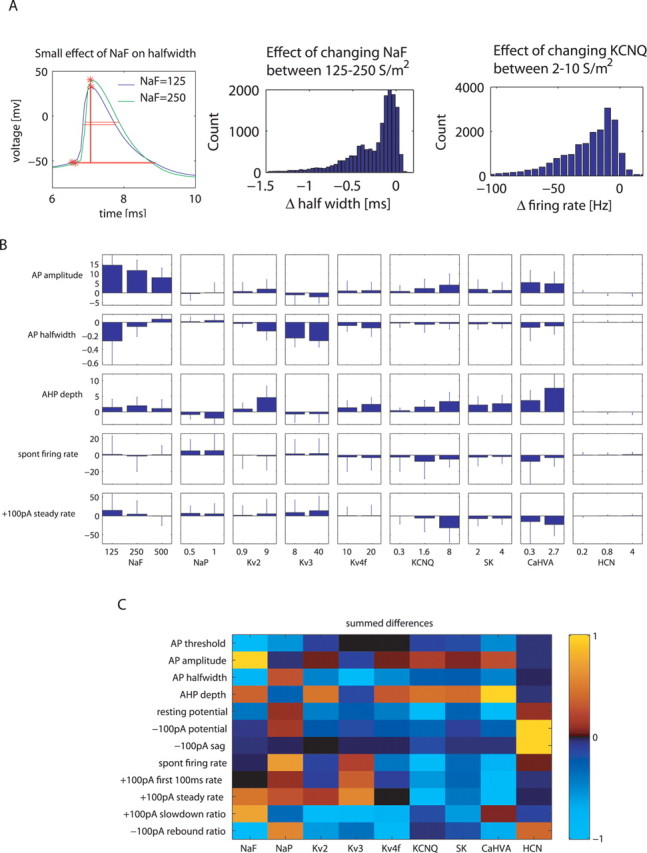
Context dependence of channel effects on measures in the entire model DB. A, As an example of context-dependent effect, this model had a smaller effect of NaF on AP half-width (left) than the model shown in Figure 3 A. The histogram of change in AP half-width with NaF conductance increases (middle) shows that the effect of NaF on the AP half-width varied between −1.5 and 0 ms based on the background context. As another example, the histogram of changes in firing rate during +100 pA CIP with KCNQ over all combinations of background conductances also showed broadly distributed values. The S/m2 ranges above the plots indicate the change in the conductance value. B, Error-bar plot representing mean and SD of the distribution of the effect caused on some important measures by change in conductance (including the examples from A). Each bar indicates the effect caused by a conductance increase of the magnitude indicated on the x-axis (i.e., the bar labeled with 125 S/m2 NaF shows the effects of increasing the conductance from 125 to 250 S/m2). C, Table representing context-independent total effect on measure value with change of conductance value from its lowest to highest level. The color of each box represents the sum of mean effect in B for each measure–conductance pair. Each row of the table is normalized to a maximal value of +1.0 or −1.0 for the largest absolute change seen for the respective measure.
