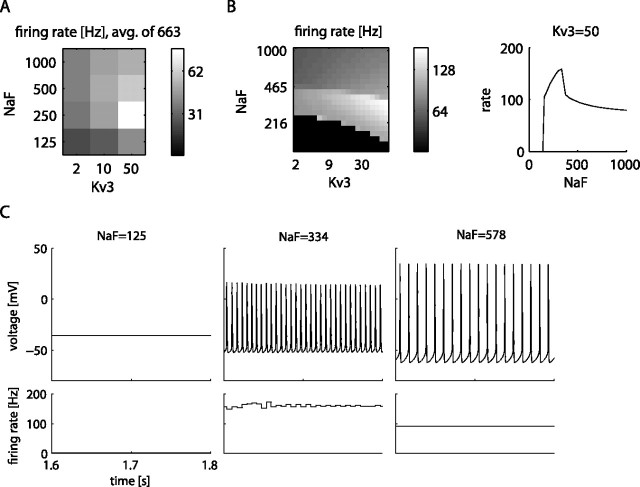
Figure 5.
Analysis of the effect of NaF and Kv3 channels on the firing rate. A, Change of spike rate with four NaF and three Kv3 levels, averaged over the 663 models with strongly reversing effects in the DB. Rate is measured during the 100 pA current injection period. avg., Average. B, Left, Same landscape from A, in a DB created with finer-grade values of 20 steps each for NaF and Kv3 for one of the 663 models (see supplemental Table 4 for the selected model parameters). Right, Line plot of spiking frequency for increasing values of NaF when Kv3 is held at 50 S/m2. C, Example voltage traces from the three distinct regions of spike frequencies shown in B.

