Figure 7.
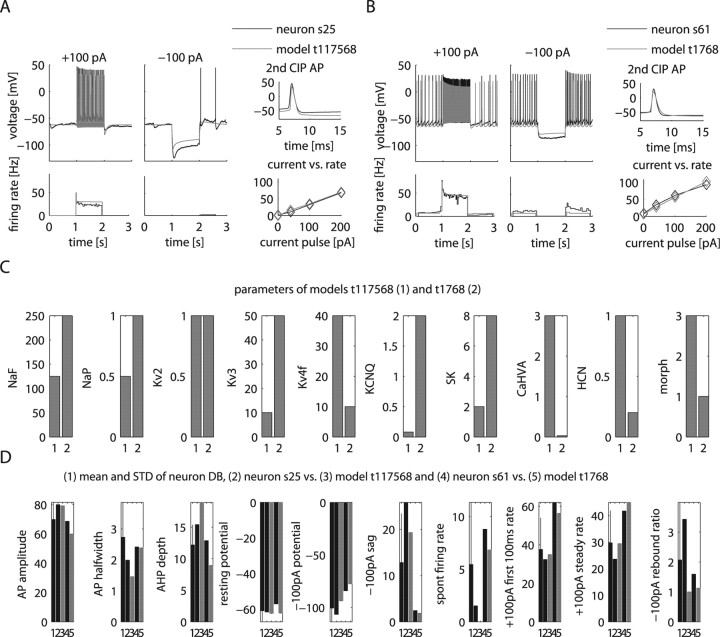
Models that best match the distinguishing features of the two GP neurons s25 and s61 from Figure 2 A. A, B, Comparison of the two recorded neurons and models selected for best matching their pronounced differences in physiological properties. The raw data traces for ±100 pA CIP are aligned with instantaneous firing rate plots shown below. Additional plots show the shapes of the second AP during the +100 pA CIP period and a graph of the firing rate versus injected current (fI curve). C, Comparison of conductance values between the two models matching the two different recordings highlight their distinctions. D, Comparison of measures between the neurons and matching models. The mean and standard deviation (STD) of the physiology DB is shown in the first column to allow a comparison of the selected neurons with the sample mean and variance. The STD of the physiology DB also indicates the relative weight of the measure used in our matching algorithm (see Materials and Methods).

