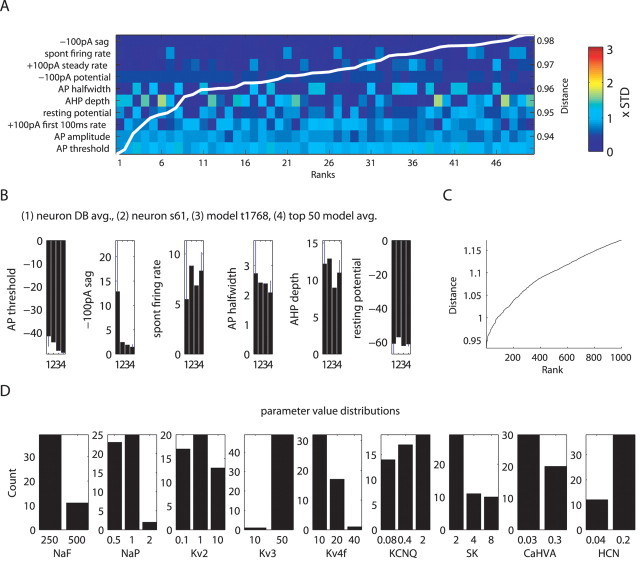
Figure 8.
Multiple similar models matching neuron s61 were found. A, Color plot of measure distances of top 50 ranking models to the recorded neuron shows the similarities between models. The colors are scaled by the standard deviation (STD) of the respective measure in the DB of 146 recorded neurons. The measures on the y-axis were sorted to have better matching measures at the top. The superimposed white-line plot shows the cumulative distance measure of each of the models, the scale bar of which appears to the right. B, Quantitative comparison of actual measure values between the physiology DB, neuron s61, best-matching model t1768, and the mean and SD of the top 50 models. avg., Average. C, Plot of sorted cumulative measure distance for the 1000 best-matching models shows that distance to the target neuron increases more steeply in the lower ranks. D, Differences in conductance densities found in the top 50 models are shown with distribution plots of conductance parameters.

