Figure 2.
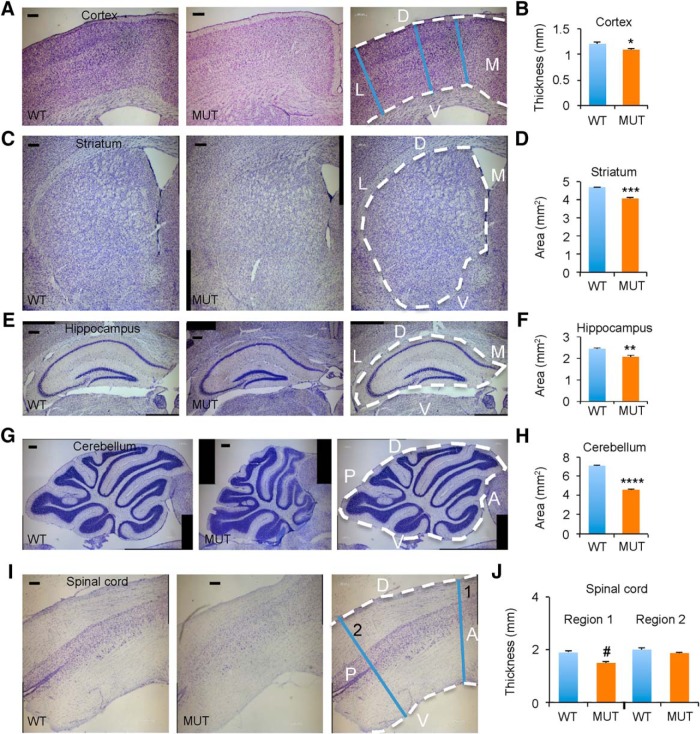
Widespread reduction of neural tissue in aged Nhe6-null mice. A, C, E, G, I, Representative images of 30-μm brain sections from 22-mo-old WT and MUT male littermate mice after Nissl staining. Shown are coronal brain sections of cortex (A), striatum (C), and hippocampus (E) and sagittal sections of cerebellum (G) and spinal cord (I). Rightmost panels depict sections overlaid with anatomic labels for orientation purposes and blue lines indicating regions of measurement for assessment of atrophy. Two different anterior-posterior thicknesses of spinal cord (1 and 2) are shown and were analyzed (I). D, dorsal; L, lateral; V, ventral; M, medial; A, anterior; P, posterior. Scale bars, 200 μm. B, D, F, H, J, Graphs depicting quantification of thicknesses or areas of different brain regions in MUT male mice compared with WT male littermates, with each graph corresponding to the brain region reflected in the images to its left. WT n = 3, MUT n = 3 (B, D, and F); WT n = 2, MUT n = 4 (H); WT n = 2, MUT n = 2 (J). Data are presented as mean ± SEM. Statistical analyses were conducted using two-tailed Student’s t tests. *, p = 0.025 (B); ***, p = 0.00031 (D); **, p = 0.0098 (F); ****, p = 4.6 × 10⁻⁵ (H); #, p = 0.060 (J, Region 1); p = 0.24 (J, Region 2).

