
Fig. 2. 14C-CH4 data from each station and Keeling plot analysis.
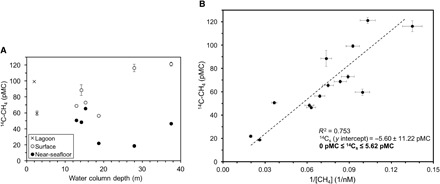
(A) Dissolved 14C-CH4 data for stations 1 to 8, plotted by the water depth of the station. The data include lagoon samples (×), surface samples (white circles), and near-seafloor samples (black circles). Error bars that are not visible are smaller than the markers. Uncertainty for 14C-CH4 data incorporates the collection, preparation, and measurement uncertainties (20). (B) A Keeling plot (Eq. 3) incorporating [CH4] and 14C-CH4 measurements from stations 1 to 8 suggests that the system can be viewed as a pseudo–two-component mixture and that the 14C-CH4 source signature (14Cs) likely ranges from 0 to 5.62 pMC.