
Fig. 1. De novo microtissue growth rate increased with cytoskeletal tension.
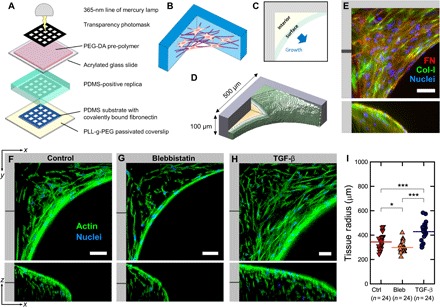
(A) Schematic of the microfabrication process used to produce thick 3D PDMS substrates with controlled macroscopic geometry. Detailed illustrations of the fabrication process are shown in fig. S5. (B) Illustration of 3D tissue growing in the corners of rectangular substrate pores. (C and D) Illustration of surface and interior regions and tissue dimensions. (E) Maximum intensity projection of the resulting 3D tissue containing cells (blue) and ECM (red, FN; green, Col-I; blue, nuclei). The tissue is rich in both FN and Col-I fibers. (F to H) Single slices through tissues (green, actin; blue, nuclei) at the indicated depth in xy and xz directions, under normal conditions (left) and under conditions of inhibited (middle) and elevated (right) cytoskeletal tension in the presence of 10 μM blebbistatin or TGF-β1 (1 ng/ml), respectively. The individual channels and an animated z fly-through are shown in fig. S1 and movie S1, respectively. (I) Quantification of tissue radius (distance between the scaffold corner and the growth front at 40 μm of z depth) after 19 days of growth under normal conditions and in the presence of 10 μM blebbistatin or TGF-β1 (1 ng/ml), respectively. Increased cytoskeletal tension results in increased tissue volume. Scale bars, 50 μm. Data points indicate the tissue radius for individual tissues.