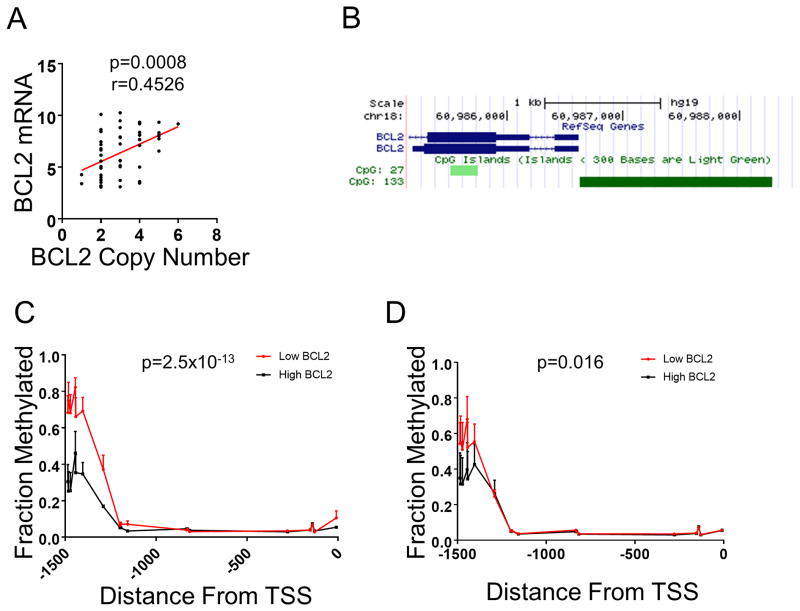
Figure 3. Methylation of the BCL2 promoter correlates with RNA expression.
(A) BCL2 expression correlates with DNA copy number. Correlation analysis was performed using Spearman's correlation. (B) A CpG island exists within a 1.5kb region upstream of the BCL2 transcriptional start site. (C) Methylation within the CpG island of BCL2. Top 50% of BCL2 expressing SCLC cell lines (black line; n=8) with two copies of BCL2 are compared to the bottom 50% BCL2 expressers (red line; n=8). (D) Methylation of within the CpG island of BCL2. Top 50% of BCL2 expressing SCLC cell lines (black line; n=6) with three copies of BCL2 are compared to the bottom 50% BCL2 expressers (red line; n=7). Statistical significance between methylation status was determined using ordinary ANOVA analysis.

