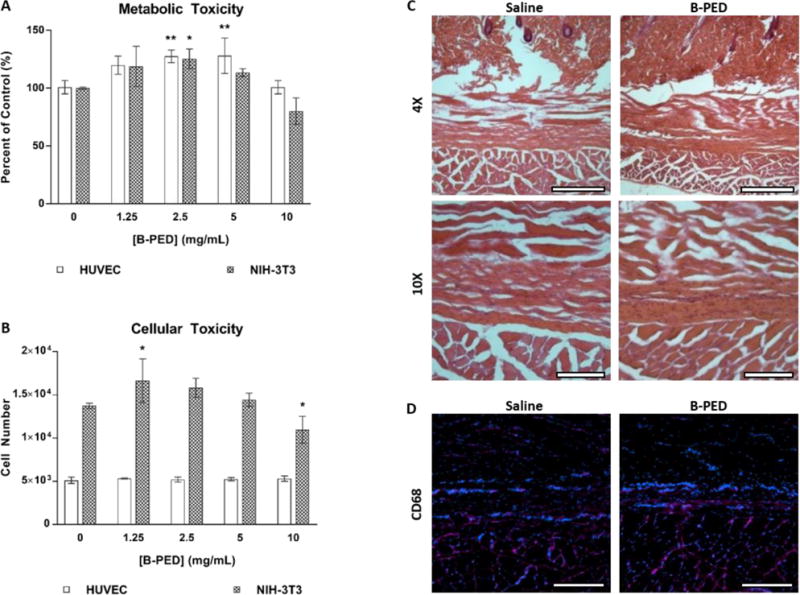
Fig. 2. B-PED Biocompatibility.

A. The effect of [B-PED] on HUVEC and NIH-3T3 cells is assessed via a metabolic and B. nucleic acid quantification assay (n=3, mean ± SD, *p<0.05, **p<0.01 compared to control). C. 100 μL of physiological saline or 10 mg/mL B-PED is subcutaneously injected into Sprague-Dawley rats. Tissues are harvested 1 week post-injection and visualized via H&E staining (scale bar, top: 100 μm, bottom: 500 μm). C. CD68 immunofluorescence staining shows minimal macrophage infiltration for both saline- and B-PED-treated rats (red: CD68, blue: nuclei, scale bar: 200 μm).
