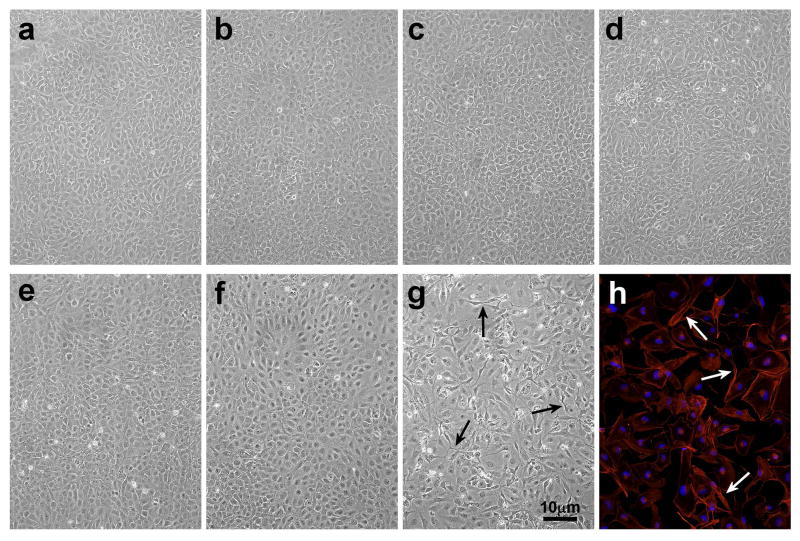
Figure 2.
Photographs of cultured human LECs at various times after exposure to either a low dose (0.09 mW/cm2) or high dose (0.9 mW/cm2) of UVB radiation for 2.5 min in 60 mm plates. a. 24 hr control; b. low dose UVB, 1 hr; c. low dose UVB, 3 hr; d. low dose UVB, 24 hr; e. high dose UVB, 1 hr; f. high dose UVB, 3 hr; g. high dose UVB, 24 hr; h. high dose UVB, 24 hr, stained for F-actin. Note the cell loss and abnormal threadlike structures between cells (arrows) in g and h. The results are representative of three experiments.

