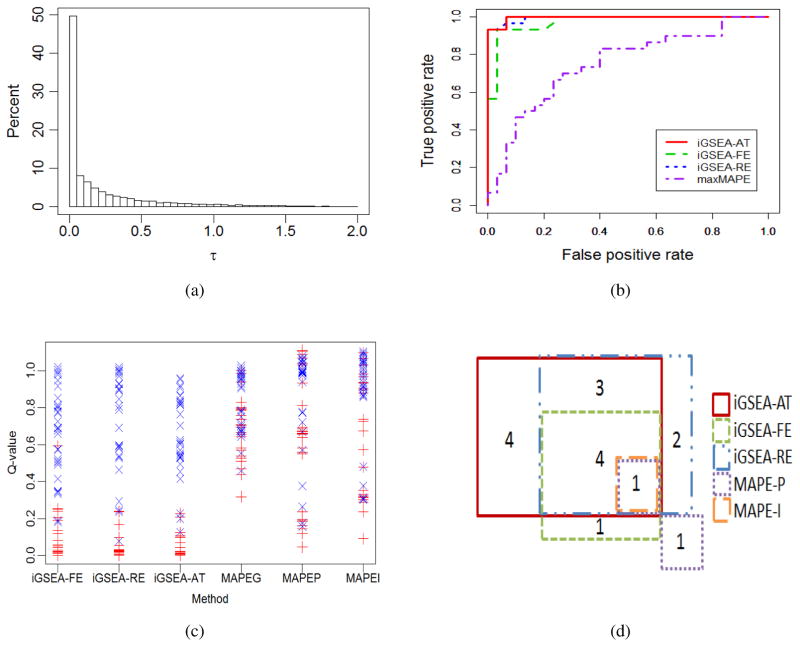
Figure 3.
Data example: (a) the histogram of estimated between-study heterogeneity ; (b) ROC curves of the three iGSEA methods and MAPEI using 60 constructed benchmark pathways; (c) Estimated Q-values of benchmark pathways from the six methods, where red “×”s and blue “+”s represent positive and negative controls, respectively; (d) Venn diagram of enriched KEGG pathways identified by at least one of the methods.

