
Figure 2. Cubic spline plots of the association between systolic blood pressure and usual sodium excretion, usual potassium excretion, and their ratio, among adults aged 20–69, NHANES 2014.
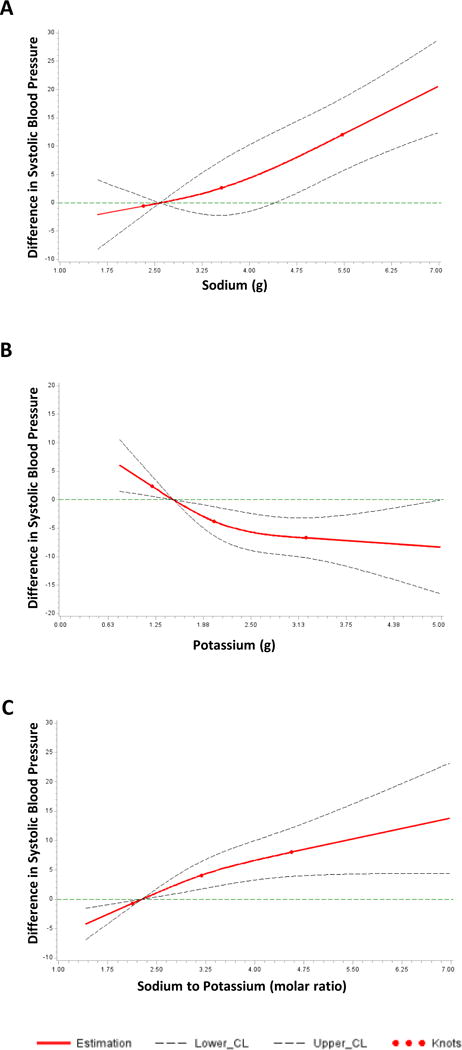
In Panel A, the y-axis shows difference in systolic blood pressure across sodium excretion values compared to a reference value of 2.58g (the midpoint of the lowest quartile). The overall association was significant (p<0.001) and the test of non-linear association was not significant (p=0.41). Panel B shows difference in systolic blood pressure across potassium excretion values compared to a reference value of 1.48g. The overall association was significant (p=0.007) and the test of non-linear association was not significant (p=0.13). Panel C shows difference in systolic blood pressure across sodium-to-potassium ratio values compared to a reference value of 2.27. The overall association was significant (p=0.006) and the test of non-linear association was not significant (p=0.28).