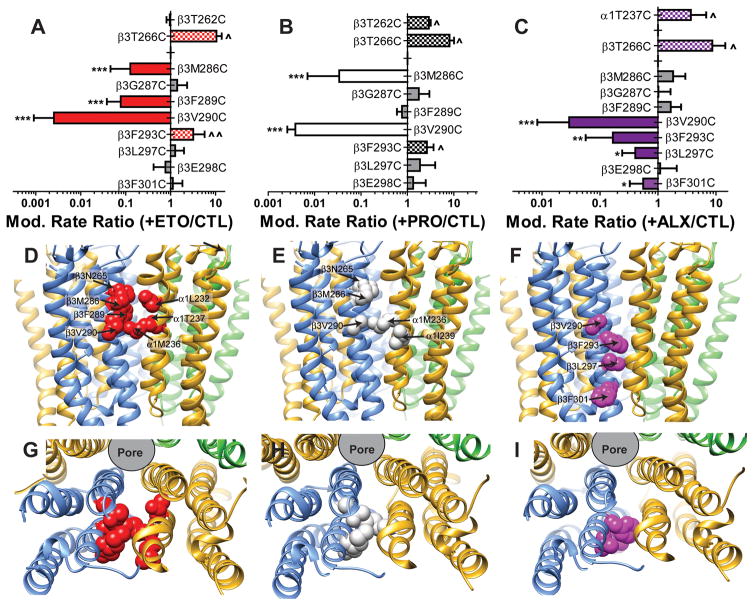
Fig 5. Summary of substituted cysteine modification and protection results by anesthetic drug.
The top row of panels summarizes the ratio of modification rates (mean ± sd) in the presence vs. absence of anesthetic for each drug at the mutations used in the current study. Cases where no significant change was observed are indicated by gray bars. Cases where anesthetics caused significant slowing of modification are identified by solid colored bars and those where anesthetics produced significant acceleration of modification are identified by checked bars with the same coloring scheme (etomidate = ETO, red; propofol = PRO, white; alphaxalone = ALX, purple). Contact between anesthetics and sidechains is inferred in cases where modification is inhibited. Significance is annotated as described for figure 4J. The middle row of panels depicts the transmembrane domain backbone ribbon structure of our α1β3γ2L homology model as viewed from the side. Subunit color coding is the same as in Fig 1. Contact residues, based on both photolabeling and substituted cysteine modification-protection studies, are identified for each drug in separate panels as colored and labeled space-filling models. The bottom set of panels depict the same models and contact sidechains viewed from the extracellular space, with the extracellular domains removed.

