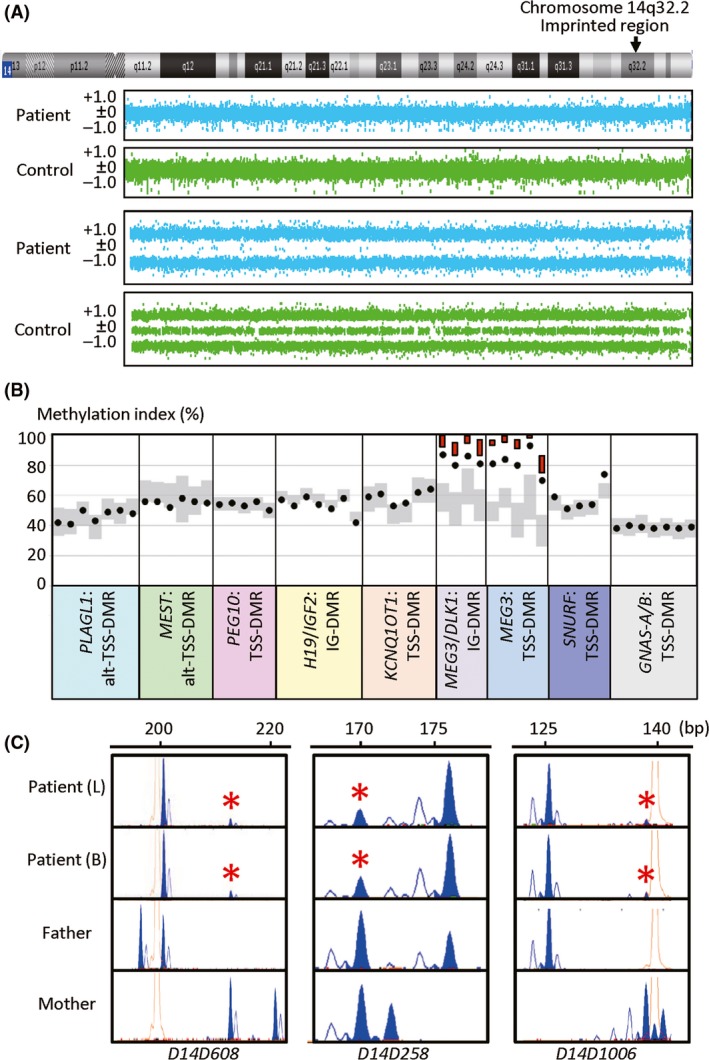
Figure 1.

Representative molecular findings. (A) Array CGH and SNP array analyses for chromosome 14. The upper two panels show array CGH findings. The vertical axis shows log2 signal ratios, and the signals around +0.5, ±0, and −1.0 indicate duplicated, normal, and deleted segments, respectively. A region with ≥three consecutive dots that are present in increased or decreased log2 signal ratios is regarded as a copy number variant, and there is no such a region in this patient as well as in a control subject. The lower two panels show the SNP array findings. Most SNPs are present in a homozygous status (+1.0 or −1.0), and a small number of SNPs are apparently present in a heterozygous status (±0) in this patient, whereas examined SNPs are present in both homozygous and heterozygous conditions in the control subject. (B) Methylation indices (MIs, the frequencies of methylated clones) of the CpG sites within nine DMRs examined by pyrosequencing. The black circles show the MIs of this patient. Gray vertical bars indicate the ranges of MIs (minimum–maximum) in 50 control subjects, and the red bars for the MEG3/DLK1:IG‐DMR and MEG3:TSS‐DMR represent the range of MIs (minimum–maximum) in 11 KOS patients with upd(14)pat. (C) Microsatellite analysis. Major peaks of paternal origin and minor peaks of maternal origin (red asterisks) are identified in this patient. For D14S258, while the minor peak could be of paternal or maternal origin, overall SNP array data and microsatellite data indicate that the minor peak is of maternal origin (see Note S1). L: leukocytes, and B: buccal cells.
