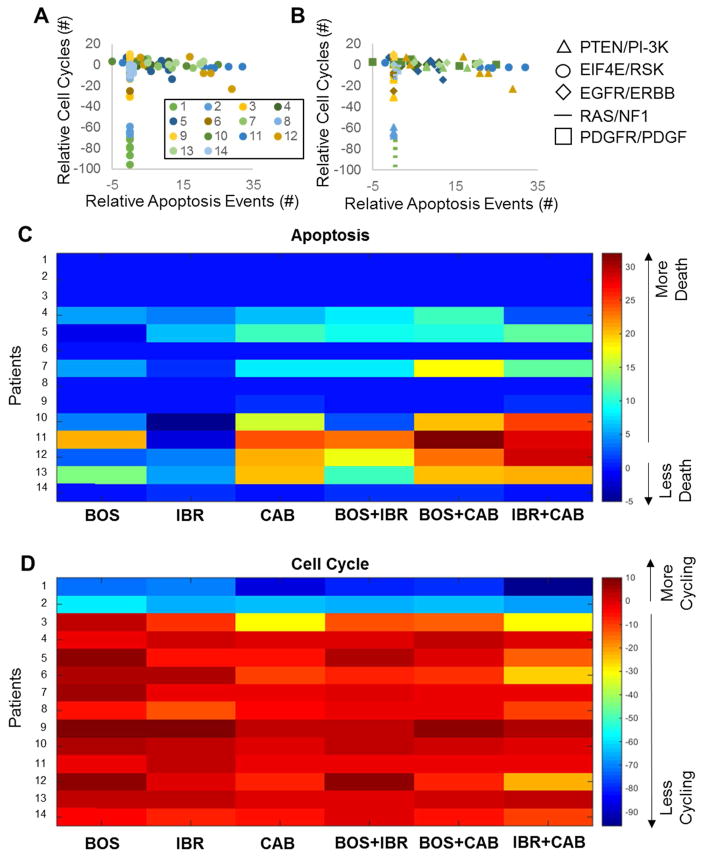
Figure 6. Simulated Drug and Drug Combination Responses Across Patients.
For every initialized patient’s heterogeneous cell population, all three drugs alone or in combination were given at a constant concentration of 10 uM for 72 hours. The number of cell division events (Cyclin A peaks) or apoptosis events (cleaved PARP crossing) were counted, and then analyzed relative to a no drug control. A–B. Simulation results across all patients (different colors), for all drug treatment conditions. In (B), different marker types correspond to different transcriptomic aberrations, whereas color still is matched for patients as in (A). C–D. Heatmap representations of the number of apoptosis events (B) or cell cycle events (C) across patients and drugs.

