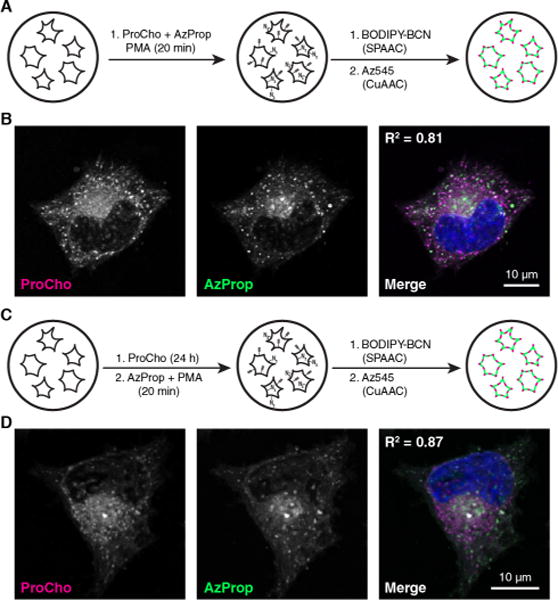
Figure 4.

Two-color imaging of PLD activity and PC biosynthesis with orthogonal chemical reporters. (A) Schematic for simultaneous, two-color labeling of PLD activity with AzProp and ProCho. (B) HeLa cells were treated with ProCho (100 μM), AzProp (750 μM), and PMA (100 nM) for 20 min, rinsed, labeled with BODIPY-BCN via SPAAC, fixed, tagged with Az488 via CuAAC, and imaged by confocal microscopy. (C) Schematic of two-color labeling of PC biosynthesis and PLD activity. (D) HeLa cells were treated with ProCho (100 μM) for 24 h to report on PC biosynthesis, rinsed, and then incubated in AzProp (1 mM) for 20 min followed by an additional 20 min incubation with PMA (100 nM) to report on stimulated PLD activity. Cells were then fixed, labeled via SPAAC and CuAAC, and imaged as in panel B. The merge image shows ProCho (magenta), AzProp (green), and DAPI (blue); colocalization of ProCho and AzProp appears white. Pearson correlation coefficients (R2) are provided to aid in interpreting colocalization of the two markers.
