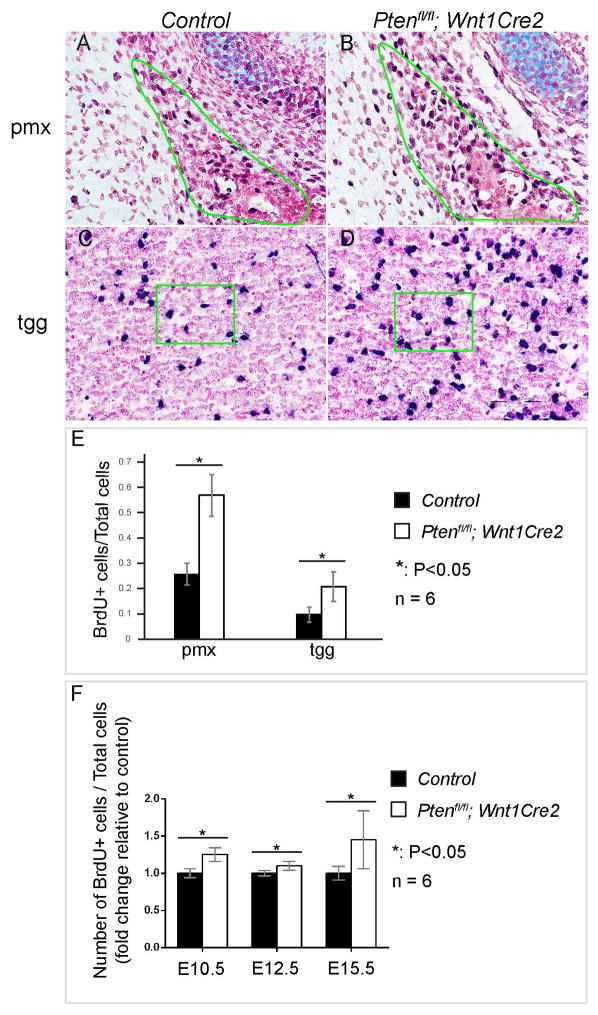
Fig 5. Pten is essential to regulate proliferation of osteoprogenitors and tgg cells.
(A–D) BrdU labeling on frontal sections of littermate control (A, C) and Ptenfl/fl; Wnt1Cre2 (B, D) at E13.5, with a focus on pmx (A, B) and tgg (C, D). Slides were counterstained with nuclear fast red to facilitate quantification. (E) Quantification result and statistical analysis of percentage of BrdU+ cells in control and Ptenfl/fl; Wnt1Cre2 tissues. (F) Quantification and statistical analysis of the percentage of BrdU+ cells in Ptenfl/fl; Wnt1Cre2 and littermate control pmx at E10.5, E12.5 and E15.5. The result is presented as fold change relative to the control. pmx, premaxilla; tgg, trigeminal ganglion.

