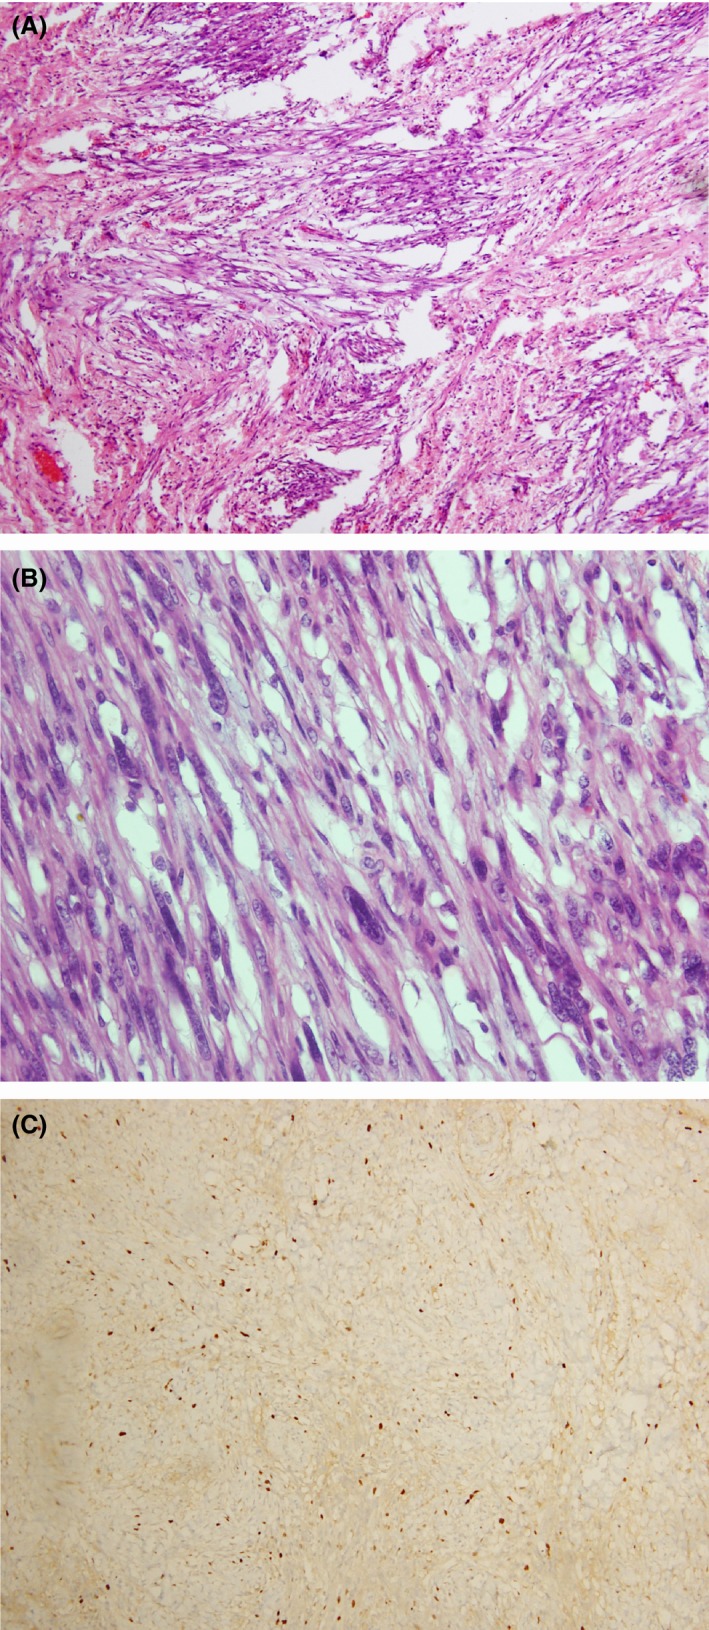
Figure 2.

(A–C) Histology of inflammatory myofibroblastic tumor of esophagus. (A) H&E staining viewed under x 10 showing aggregate of spindle‐shaped cells with inflammatory infiltrate. (B) H&E staining viewed under x 40 showing spindle‐shaped cells with elongated mildly hyperchromatic nuclei and pale cytoplasm. (C) Immunohistochemical analysis showing Ki 67 proliferative index of 5%.
