
Figure 2.
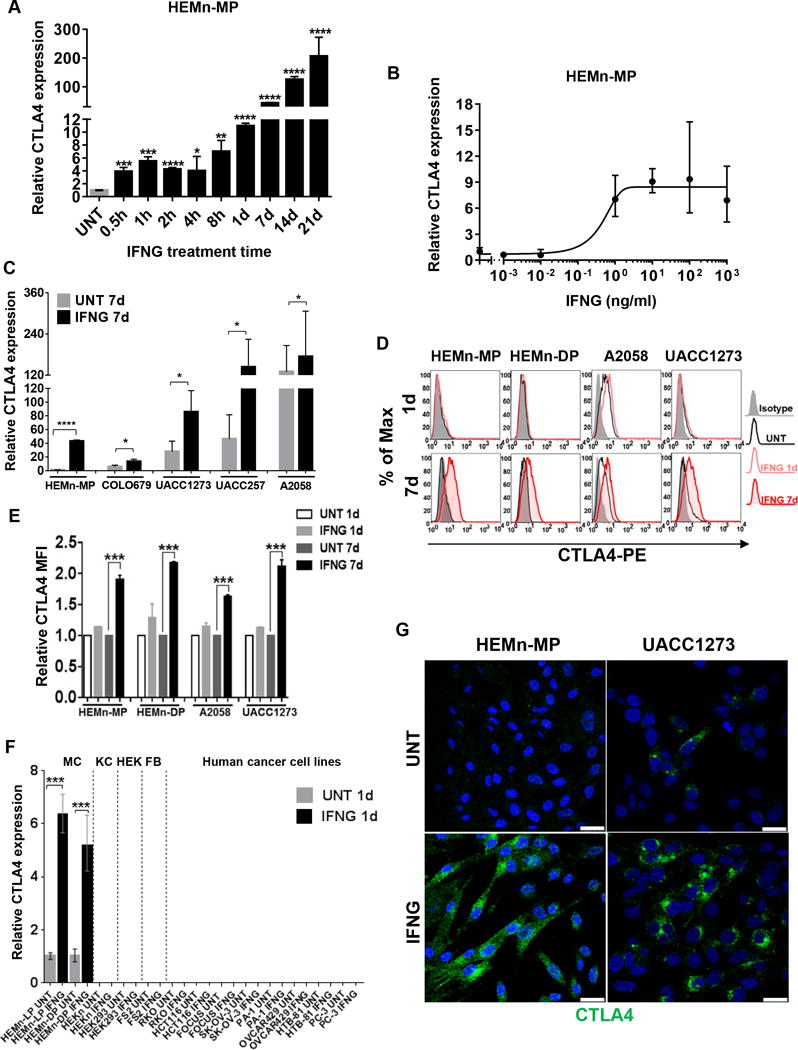
IFNG induces CTLA4 expression in human primary melanocytes and melanoma cell lines. A, qRT-PCR analysis of CTLA4 mRNA expression in HEMn-MP cells cultured in the presence or absence of 10 ng/ml IFNG is shown at indicated time points. B, qRT-PCR analysis of CTLA4 mRNA expression in HEMn-MP cells cultured in the presence or absence of indicated concentrations of IFNG for 1d. C, qRT-PCR analysis of CTLA4 mRNA expression in cells that were cultured for 7 days in the presence or absence of 10 ng/ml IFNG. D, Total CTLA4 protein expression in fixed and permeabilized human melanocytes and melanoma cell lines cultured in the presence or absence of 10 ng/ml IFNG for either 1d or 7d, immunostained with either mouse anti-human CTLA4-PE (BNI3) or isotype-PE control antibody, and analyzed by flow cytometry. Data are representative of at least three independent experiments. E, Histogram representing the average MFI±SEM of three independent experiments. Y axis, fold-change of CTLA4 MFI is compared to the untreated (UNT) group. F, qRT-PCR analysis of CTLA4 expression in human primary neonatal melanocytes (MC); human epidermal neonatal keratinocytes (KC); human embryonic kidney cells (HEK); human fibroblast cell line (FB); and the indicated human solid cancer cell lines. RKO/HCT116, human colon carcinoma cell lines; FOCUS, human hepatocellular carcinoma; SK-OV-3/OVCAR429, human ovarian adenocarcinoma cell lines; PA-1, human ovarian teratocarcinoma cell line; HTB-81/PC-3, human prostate carcinoma cell lines. G, Confocal photomicrographs of CTLA4 immunostaining (green) in HEMn-MP and UACC1273 cells that were cultured in presence or absence of 10 ng/ml recombinant IFNG for 7d. Blue, DAPI. Images are representative of three independent experiments. Scale bar=25μm. All graphed data are presented as mean±SEM of three biological replicates. *P<0.05; **P<0.01; ***P<0.001; ****P<0.0001.