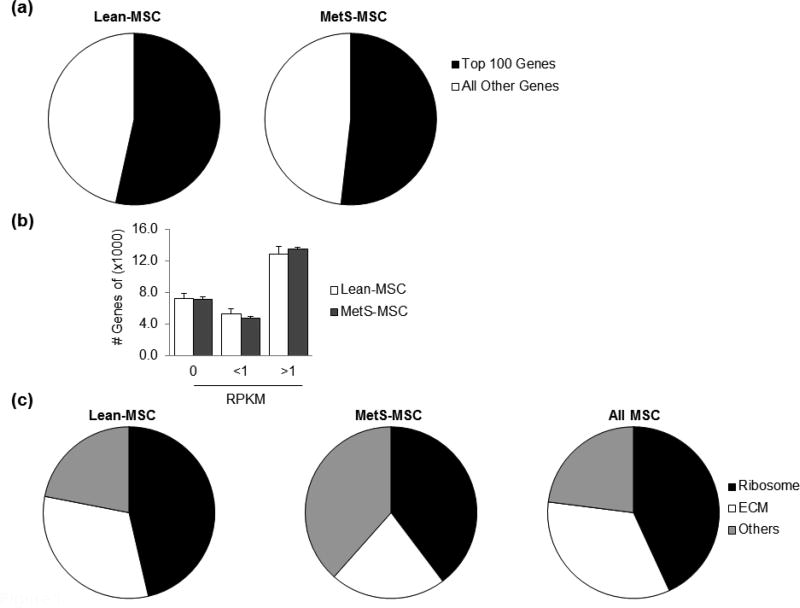
Figure 1. Genes in porcine MSC.
(a) Pie chart showing the distribution of genes in lean- and MetS-MSC. The top 100 genes expressed in both lean- and MetS-MSC represent over half of mapped transcripts. (b) The number of genes showing RNA reads of 0, <1 and >1 were similar in lean- and MetS-MSC. Nearly 45% of annotated genes are expressed at levels >1 RPKM. (c) Functional analysis of lean- and MetS-MSC (DAVID 6.7) revealed that mRNAs expressed at >1000 RPKM encode proteins associated with ribosomal and ECM proteins.

