Figure 2.

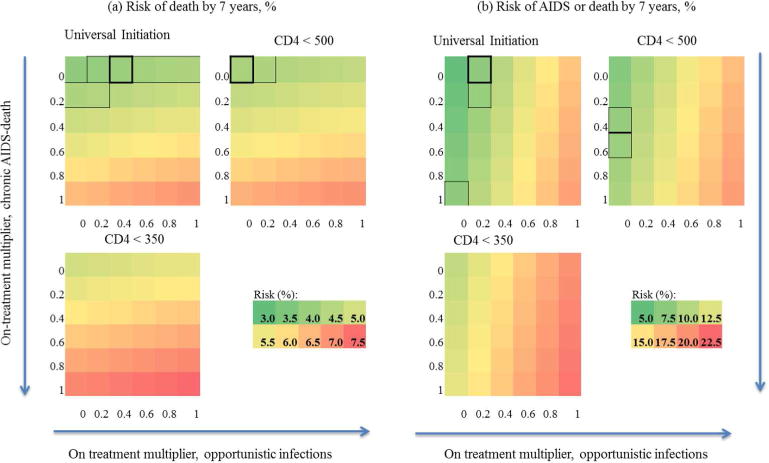
7-year mortality (a) and combined mortality/AIDS risk (b) from CEPAC calibration runs for baseline on or after Jan 1, 2003, varying on-ART multipliers for chronic AIDS-related mortality and opportunistic infections from 0 to 1 by 0.2, stratified by treatment strategy.
Scales for each outcome shown below the strategy ‘CD4 < 500’. On-treatment multiplier for chronic AIDS-related mortality increases from 0 to 1 down y-axis, on-treatment multiplier for opportunistic infections increases from 0 to 1 across x-axis, following direction of arrows. Black boxes indicate closest matchs to parametric g-formula estimates when baseline is on or after Jan 1, 2003; grey boxes indicate 95% confidence interval for parametric g-formula using 500 bootstrap samples. For the strategy ‘treat at CD4 < 350’, no CEPAC runs resulted in risk estimates within the g-formula 95% confidence intervals for either outcome. CEPAC: Cost-Effectiveness of Preventing AIDS Complications model.
