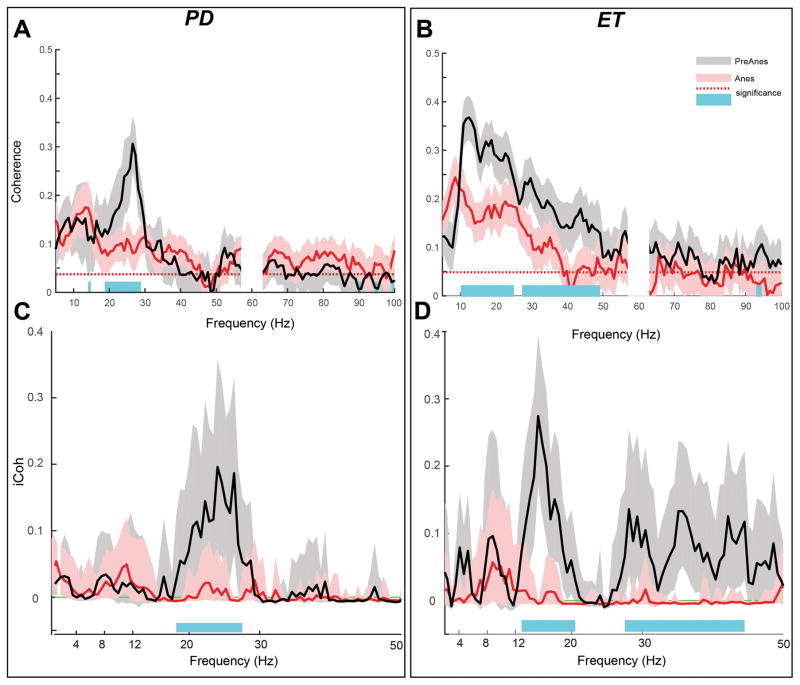
Figure 2.
Changes in sensorimotor power and coherence in an example subject (A) Time frequency representation of power for three cortical signals investigated (top to bottom) indicating local power increase for frequencies <100 Hz similarly at all sensorimotor cortices. Dashed vertical line indicates timing of propofol injection (bolus) (B) Time frequency representation of coherence (i.e. coherogram) between signals recorded from Pre and Post central gyri (PreCS and PostCS, respectively) from the sample subject as in panel (A) indicating de-coherence in beta (13–30 Hz) between sensory and motor cortices.

