
FIG. 3.
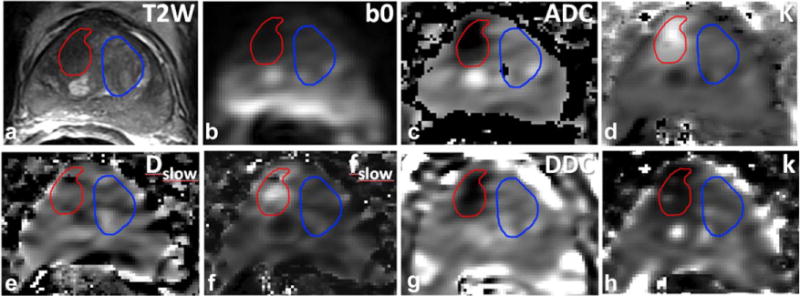
MR data of a 77-year-old patient with a PSA level of 13.8 ng/mL and a Gleason score 4 + 3 tumor on biopsy. (a) T2-weighted image with a tumor suspicious region outlined in red in the right TZ and normal appearing TZ tissue, outlined in blue. (b) b = 0 s/mm2 image of extended-range b-factor DWI. (c) Map of ADC derived from the monoexponential fit of the data (mean value tumor ROI: 0.78 μm2/ms and normal TZ ROI: 1.46 μm2/ms). (d) Map of K derived from the kurtosis model fit excluding b = 0 (mean value tumor ROI: 0.90 μm2/ms and normal TZ ROI: 0.53 μm2/ms). (e) Map of Dslow of the biexponential model fit excluding b = 0 (mean values for tumor ROI: 0.24 μm2/ms and normal TZ: 0.32 μm2/ms). (f) Map of fslow derived from the biexponential fit excluding b = 0 (mean value tumor ROI: 0.40 and normal TZ: 0.16). (g) Map of DDC derived from the stretched exponential model fit including b = 0 (mean value tumor ROI: 0.85 μm2/ms and normal TZ ROI: 1.78 μm2/ms). (h) Map of k obtained from the gamma distribution model fit excluding b = 0 (mean value tumor ROI: 1.12 and normal TZ ROI: 1.81).