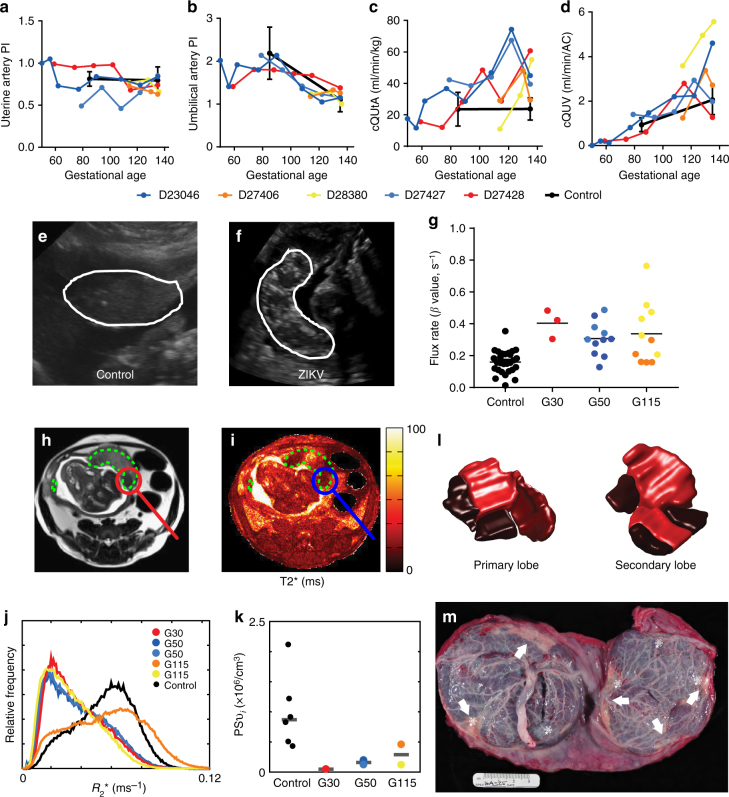
Fig. 4.
Ultrasound and MR imaging of utero-feto-placental blood flow. a Uterine artery pulsatility index, b uterine artery blood flow volume (cQUtA) corrected for maternal body weight, c umbilical artery pulsatility index, and d umbilical vein blood flow volume (cQUV) corrected for fetal abdominal circumference measured by Doppler ultrasound in the ZIKV-exposed animals and a cohort of control, non-infected rhesus macaques (n = 6, black closed circles; mean ± SEM) across gestation. e Ultrasound images showing the appearance of the placenta (white outline) in a representative control uninfected dam (102dGA) and f a ZIKV-infected dam at 61dpi (112dGA). Both images were acquired at the same gain setting. g CE-US calculated microvascular flux rate from control (n = 27 spiral artery sources from n = 7 animals) and ZIKV-infected animals. Co-registered axial MRI images from animal D23046 are shown in h (T2w HASTE acquisition) and i (quantitative T2* map). Regions of interest (ROIs) delineating both placental lobes are indicated by the dashed green lines, and a focal region of pronounced hypoperfusion is circled. j Plots normalized histograms of placental relaxation rate (R2* = 1/T2*) for all five ZIKV-infected animals (colored curves), along with the median histogram for the six control animals (black curve). k Plots median values of PSvi (averaged over all placental lobules) for each of the six control animals (black points) versus values for the five ZIKV-infected animals (colored points), stratified by gestational age at time of infection. l Shows relative blood flow for both the primary and secondary placental lobes in D23046 determined from DCE-MRI measurements for the perfusion domains corresponding to each placental lobule, as determined from DCE-MRI measurements. Darker shades indicated regions of the placenta that are hypoperfused. m Image of the fetal side of the placenta in this animal, demonstrating infarcted regions (white arrows) corresponding to the regions of hypoperfusion seen on DCE-MRI. Of note, ZIKV RNA was detected at five sites across the two placental lobes, indicated by the white asterisk. These ZIKV + areas predominantly correspond to hypoperfused cotyledons. p < 0.0001 one-way ANOVA with Tukey’s multiple comparison test, ***p < 0.001, **p < 0.01

