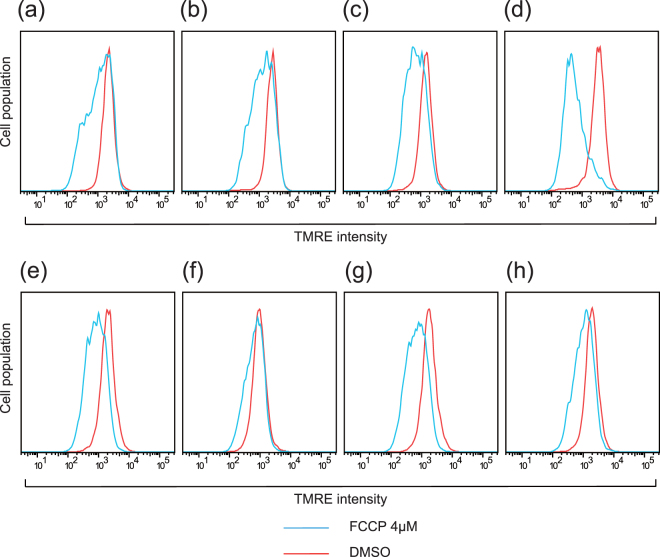
Figure 2.
Mitochondrial membrane potential of the Mt iPS cell clones, as measured by FACS analysis. Representative histograms of TMRE intensity among the Mt1 iPS cell clones ((a): 1-1low, (b): 1-2low, (c): 1-3high, (d): 1-4high) and the Mt2 iPS cell clones ((e): 2-3low, (f): 2-8low, (g): 2-6high, (h): 2-5high) are shown. The Mt iPS cells were treated with 4 μM FCCP or DMSO for 10 min and analyzed independently. The TMRE peak decreased after FCCP administration was statistically significantly lower in Mt1-4high than in Mt1-1low among the Mt1 iPS cell clones, while it was not statistically significantly different among the Mt2 iPS cell clones assessed using ANOVA with a post hoc test (Tukey’s test).

