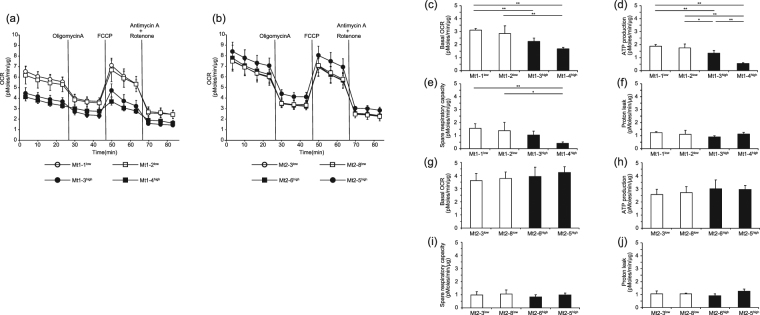
Figure 3.
The oxygen consumption rate (OCR) of the Mt iPS cell clones measured using an XF96 Extracellular Flux Analyzer. Representative data for the Mt1 iPS cell clones are shown as follows: (a) time course (open circle, Mt1-1low; open square, Mt1-2low; closed circle, Mt1-3high; closed square, Mt1-4high), (c) basal OCR, (d) ATP production, (e) spare respiratory capacity, and (f) proton leak. Representative data for the Mt2 iPS cell clones are shown as follows: (b) time course (open circle, Mt2-3low; open square, Mt2-8low; closed square, Mt2-6high; closed circle, Mt2-5high), (g) basal OCR, (h) ATP production, (i) spare respiratory capacity, and (j) proton leak. OCR was normalized to total protein and is expressed as the mean ± SD. n = 4–5. **P < 0.01 and *P < 0.05, ANOVA with a post hoc test (Tukey’s test).

