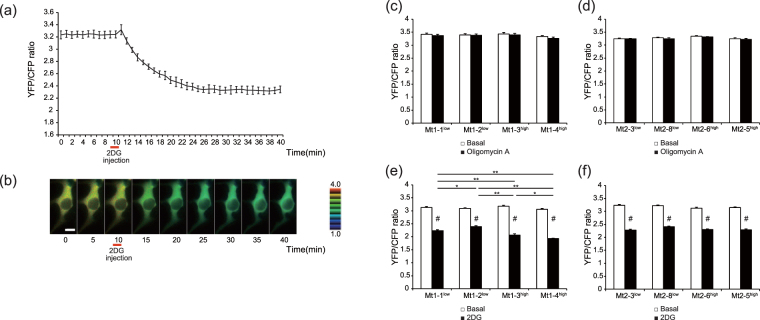
Figure 4.
Time-lapse imaging of the Mt iPS cell clones expressing ATeam1.03, a FRET-based ATP biosensor. The time course of the YFP/CFP emission ratio (a) and the sequential images (b) in a single iPS cell of Mt1-1low expressing ATeam 1.03 were examined after injection of 2DG. 2DG was injected at 10 min. The representative data are expressed as the means ± SD. n = 6 (Scale bar, 10 μm). The YFP/CFP emission ratio of the Mt1 iPS cell clones (c) and the Mt2 iPS cell clones (d) at 10 min (before the oligomycin A injection) and 30 min (20 min after the oligomycin A injection) was measured. The YFP/CFP emission ratio of the Mt1 iPS cell clones (e) and the Mt2 iPS cell clones (f) at 10 min (before 2DG injection) and 40 min (30 min after 2DG injection) was measured. The data are expressed as the means ± SE. n = 10–14 (c) (d). n = 11–16 (e) (f). **P < 0.01 and *P < 0.05, among the 2DG groups assessed by ANOVA with a post hoc test (Tukey’s test). #P < 0.01, compared with basal for each clone assessed using the Student’s t-test.

