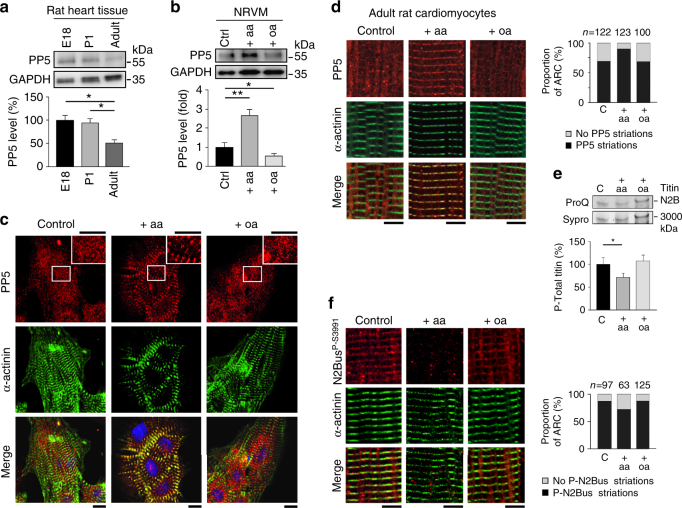
Fig. 2. Endogenous PP5 and phospho-titin in rat cardiomyocytes.
a PP5 expression by western blot in fetal (E18), newborn (P1) and adult rat heart tissue. PP5 indexed to GAPDH. Data are mean ± s.e.m., n = 5; *p < 0.05, by two-tailed Student’s t-test. b PP5 expression by western blot in neonatal rat ventricular myocyte (NRVM) cultures under baseline conditions (control) and following treatment with arachidonic acid (aa; 200 µM, 2 h) or okadaic acid (oa, 10 nM, 1 h). PP5 indexed to GAPDH. Data are mean ± s.e.m., n = 5 (three different cell culture batches); *p < 0.05 and **p < 0.01, by Bonferroni adjusted t-test. c PP5 localization in control, aa-treated, and oa-treated NRVM cultures by indirect immunofluorescence. PP5 antibody (secondary antibody: Cy3-conjugated IgG), counterstained with α-actinin antibody (secondary antibody: FITC-conjugated IgG). The merged image also shows staining of nuclei using Hoechst. Bars, 10 µm. d PP5 localization in control, aa-treated, and oa-treated adult rat cardiomyocyte (ARC) cultures by indirect immunofluorescence. The same antibodies as in c were used. Bars, 5 µm. Right bar graph shows proportion of ARC exhibiting clear PP5 striations or no such striated pattern, for each group. Numbers above columns indicate total number of cells included in the analysis. e Total titin phosphorylation in the three ARC groups measured by ProQ Diamond phosphoprotein vs. Sypro Ruby total protein stain. Bar graph shows mean ± s.e.m., n = 9 (from three independent cell preparations); *p < 0.05, by two-tailed Student’s t-test. f Localization of phosphoserine P-S3991 (titin N2Bus) in control, aa-treated, and oa-treated ARC cultures by indirect immunofluorescence, using anti-N2BusP-S3991 antibody (secondary antibody: Cy3-conjugated IgG), counterstained with α-actinin antibody (secondary antibody: FITC-conjugated IgG). Bars, 5 µm. Right bar graph shows proportion of ARC exhibiting clear N2BusP-S3991 striations or no such striated pattern, for each group. Numbers above columns indicate total number of cells included in the analysis

