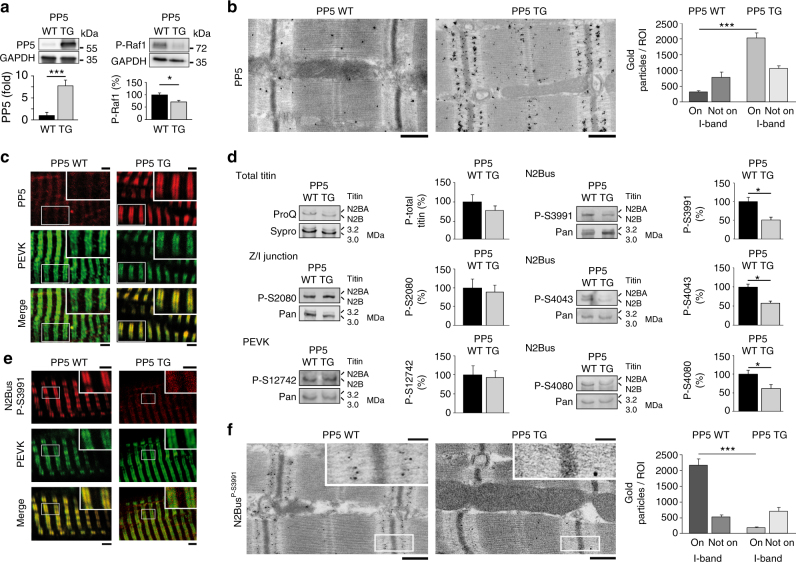
Fig. 4. PP5 and phospho-titin in PP5-overexpressing TG mouse hearts.
a Expression level of PP5 (left) and phospho-Raf1S338 (right) in PP5 TG vs. WT mouse hearts by western blot. mean ± s.e.m., n = 4 hearts/group (age 5–6 months); duplicate analysis/group. b Sarcomeric localization of PP5 in PP5 WT and TG hearts by immunogold electron microscopy. Bars, 500 nm. Bar graph shows average number of gold particles counted in 50-µm2-sized regions-of-interest (ROI), either on the sarcomeric I-band or elsewhere in the cardiomyocyte (‘Not on I-band’). Data are mean ± s.e.m., n = 5 ROIs from 2 hearts/group. c PP5 localization in cardiomyocytes from PP5 TG and WT mouse hearts by indirect immunofluorescence. PP5 antibody (secondary antibody: Cy3-conjugated IgG), counterstained with anti-PEVK (titin) antibody (secondary antibody: FITC-conjugated IgG). Bars, 2 µm (main) and 1 µm (insets). d PP5 overexpression specifically decreases titin phosphorylation at N2Bus in PP5 TG vs. WT hearts. Total titin phosphorylation measured by ProQ Diamond/Sypro Ruby staining (upper left), site-specific titin phosphorylation detected by western blot using antibodies to P-S3991, P-S4043, P-S4080 (all N2Bus; right panels), P-S2080 (titin Z/I junction), and P-S12742 (PEVK region). Phospho-titin signals were normalized to total titin signals detected by WB using a panel of sequence-specific antibodies (Pan). Means were indexed to those of control (WT) groups. Data are mean ± s.e.m., n = 4 hearts/group, samples analyzed in triplicate. e Localization of phospho-N2BusP-S3991 in cardiomyocytes from PP5 TG and WT hearts by indirect immunofluorescence. Anti-N2BusP-S3991 antibody (secondary antibody: Cy3-conjugated IgG), counterstained with anti-PEVK antibody (secondary antibody: FITC-conjugated IgG). Bars, 2 µm (main) and 1 µm (insets). f Sarcomeric localization of phospho-N2BusP-S3991 in PP5 WT and TG hearts by immunogold electron microscopy. Bars, 500 nm (main) and 100 nm (insets). Bar graph shows average number of gold particles counted in 50-µm2-sized regions-of-interest (ROI), either on the sarcomeric I-band or elsewhere in the cardiomyocyte (‘Not on I-band’). Data are mean ± s.e.m., n = 5 ROIs from 2 hearts/group. In a and d, bar graphs show relative signal changes indexed to the respective controls. In a, b, d, and f, *p < 0.05 and ***p < 0.001, by two-tailed Student’s t-test

