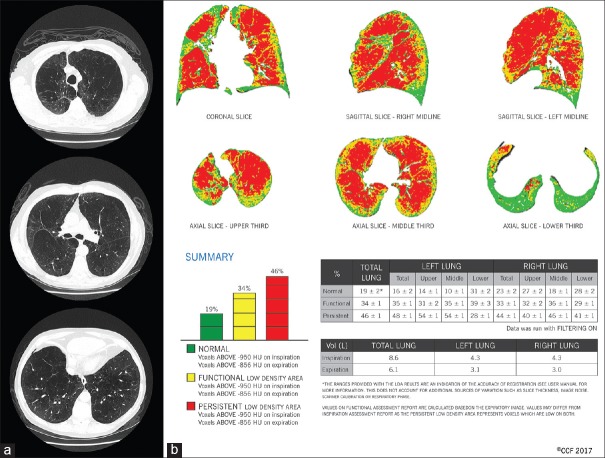
Figure 4.
(a) Visual scoring is the standard for assessing emphysema distribution. In this particular patient, computed tomography scan of the chest was scored in 3 lung zones by a thoracic radiologist in cephalocaudal direction as 3-2-2 on the right and 3-2-1 on the left, suggesting an upper lobe predominant heterogeneity in the distribution of emphysema. (b) When the same patient underwent parametric response mapping analysis, coronal and sagittal views showed a relatively diffuse distribution of emphysema (red voxels across all three regions). Percent distribution of emphysema in each zone supported a homogeneous distribution: 40%, 46% and 41% on the right and 54%, 54% and 28% on the left

