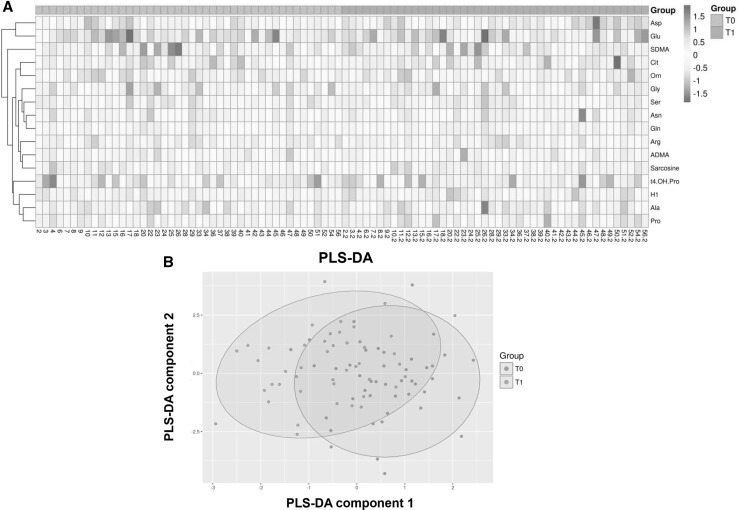
Fig. 1.
a Hierarchical cluster analysis of metabolite concentrations at T0 versus T1 of the 44 study patients. Plasma samples were measured by mass spectrometry (ESI-LC-MS/MS and MS/MS) with an AbsoluteIDQ™ p180. Numbers indicate the individual sample numbering at intervention (single number) and follow up (extension “0.2”). ADMA asymmetric dimethylarginine, Ala alanine, Arg arginine, Asn asparagine, Asp asparate, Cit citrulline, Gln glutamine, Glu glutamate, Gly glycine, Orn ornithin, Pro proline, SDMA symmetric dimethylarginine, Ser serine, t4-OH-Pro trans 4-hydroxy-proline. b Score plot of the PLS-DA analysis comparing the log transformed datasets of metabolite concentrations at T0 (red) versus T1 (blue). The areas represent the 95% confidence interval. R2X = 60.1%, R2Y = 23.1%

