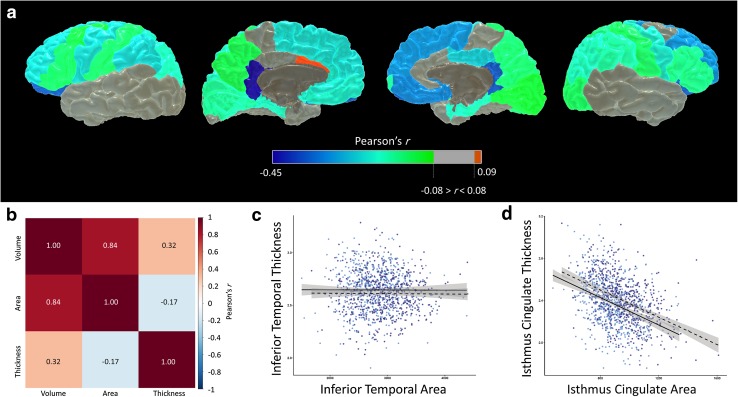
Fig. 2.
a Regional associations between raw cortical surface area and thickness; b correlation matrix of associations between global volume, surface area, and thickness; c absence of association between cortical surface area and thickness in inferior temporal gyrus; d strongest negative association between cortical surface area and thickness is exhibited in the isthmus cingulate gyrus. For panels c and d, light blue points and solid regression lines (with shaded 95% confidence intervals) denote right sided measures, and dark blue points and broken regression lines indicate left sided measures

