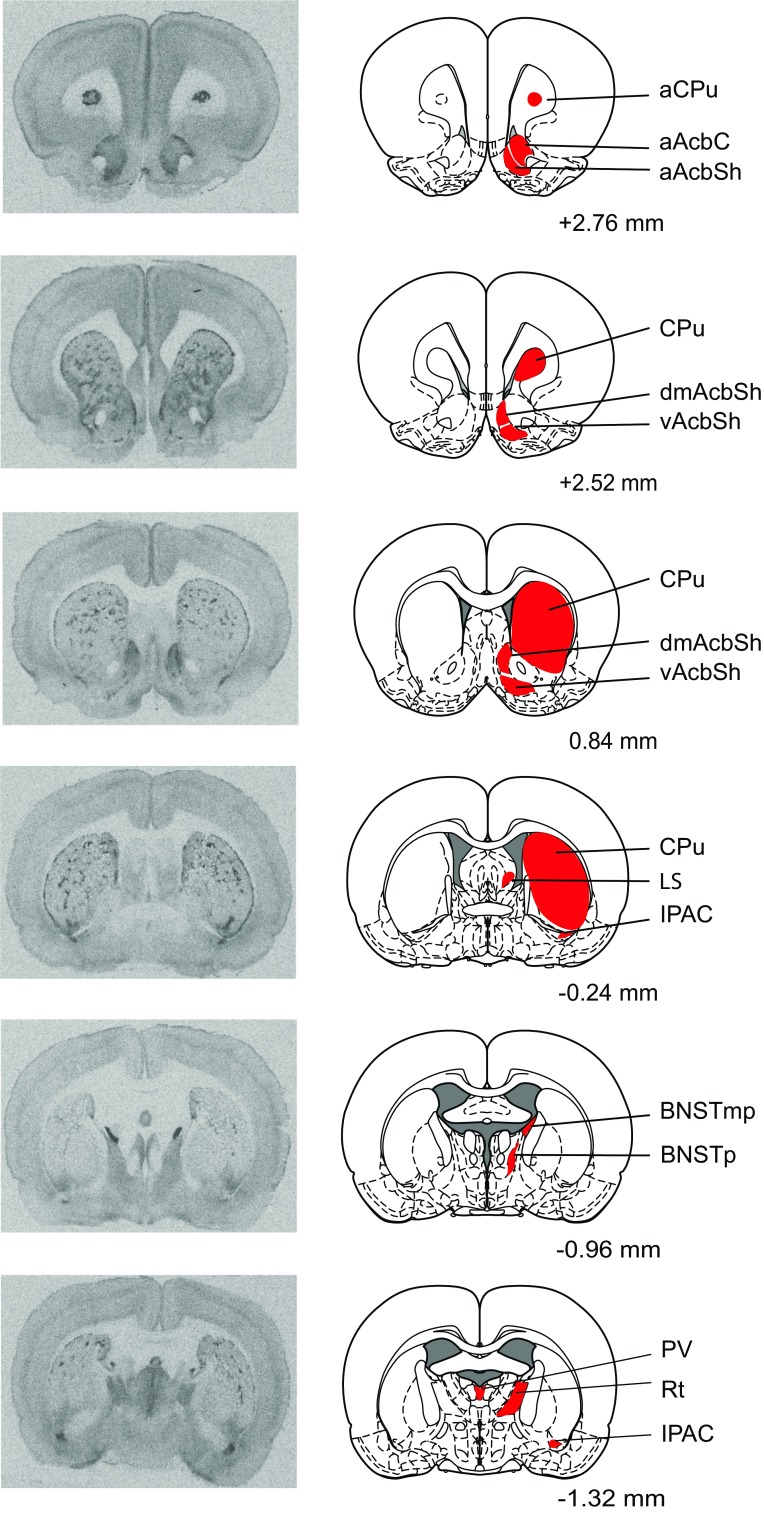
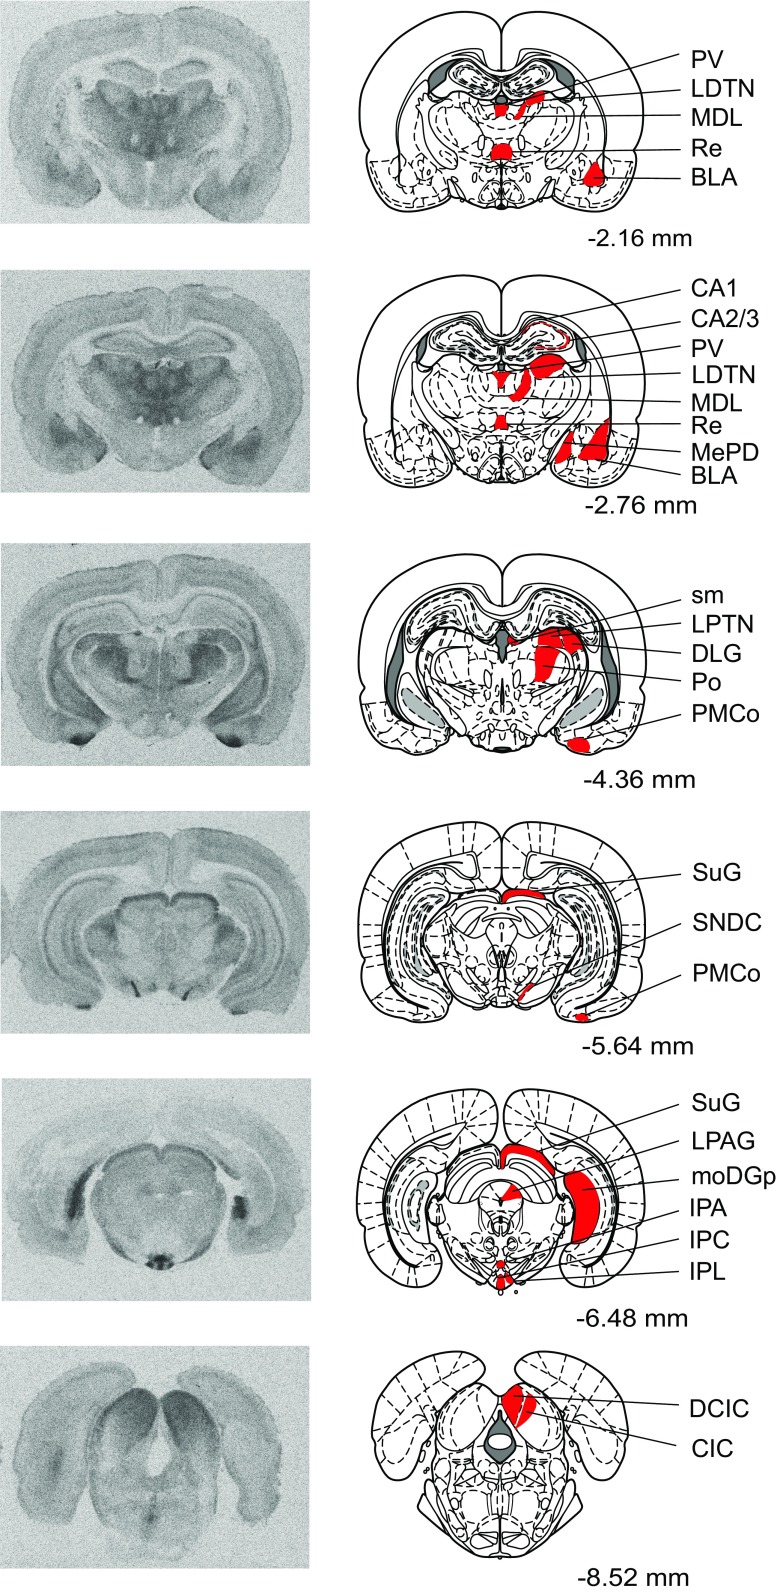
Fig. 2.
Representative autoradiograms of MOR binding in coronal rat brain sections. Brain regions in which MOR binding was measured are highlighted in red. Distances are measured in millimeters from bregma, according to Paxinos and Watson (2007). Note that while many brain regions are analyzed across multiple bregma distances, regions are highlighted in the most representative atlas images only


