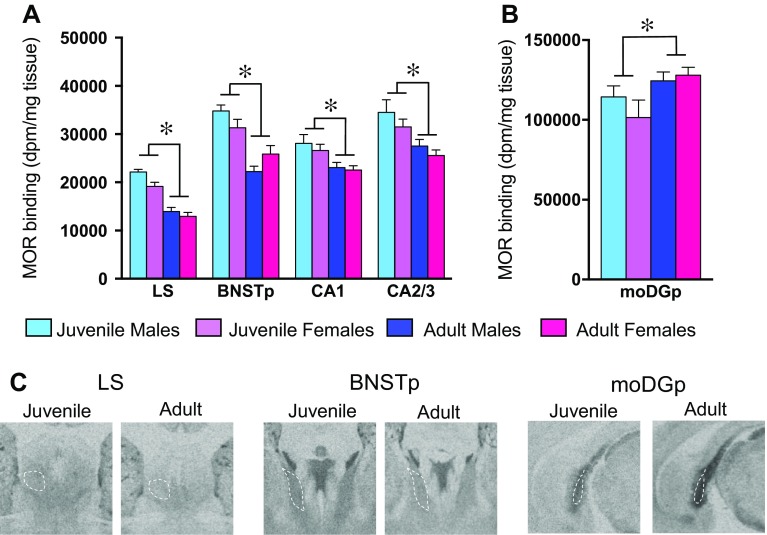
Fig. 4.
Age differences in MOR binding density in the telencephalon. Brain regions in which MOR binding density is higher (a) or lower (b) in juveniles as compared to adults within the telencephalon. Representative autoradiograms of age differences in MOR binding density in the LS, BNSTp, and moDGp (c). Bars in a, b indicate mean + SEM; two-way ANOVA (age × sex) with FDR correction for multiple comparisons: *FDR α < 0.013

