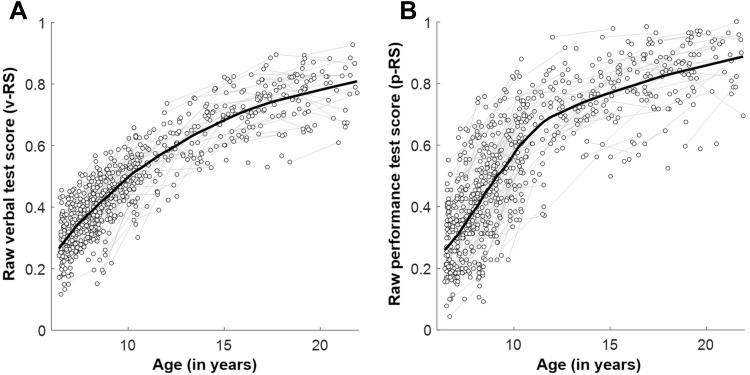
Fig. 1.
Intellectual development. Spaghetti plot illustrating the development of a raw verbal (v-RS) and b raw performance (p-RS) test scores for 495 participants of which 239 provided measures for two time points (connected with gray lines). Solid black line represents the locally weighted scatterplot smoothing (LOWESS, smoothing factor, f = 0.25)

