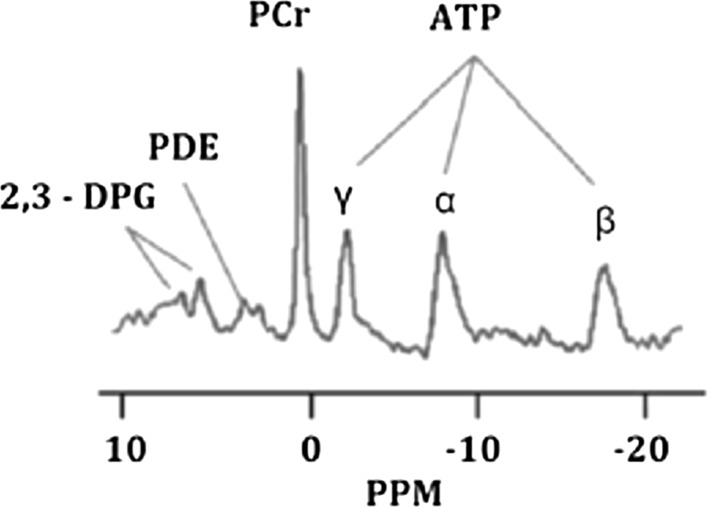
Fig. 7.
Typical 31P-magnetic resonance spectroscopy spectrum showing 2,3-diphosphoglycerate (2,3-DGP), phosphodiester (PDE), phosphocreatine (PCr), and the three phosphorus peaks of ATP (γ, α, and β). The x-axis is expressed in parts per million (ppm) [108]

