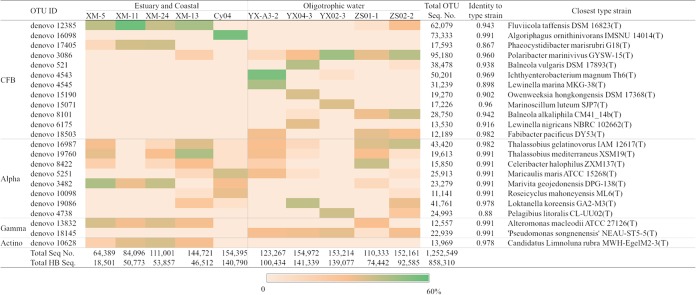
FIG 1.
The relative abundances of the dominant heterotrophic bacterial OTUs in each 16S rRNA-sequenced Synechococcus culture sample (after removing Synechococcus sequences). Total Seq. No., the total number of sequences including Synechococcus and heterotrophic bacteria in each sample; Total HB No., total number of heterotrophic bacterial sequences (without Synechococcus) in each sample; Total OTU Seq. No., the sum of sequences for each OTU in the 10 samples. Alpha, Alphaproteobacteria; Gamma, Gammaproteobacteria; Actino, Actinobacteria.

