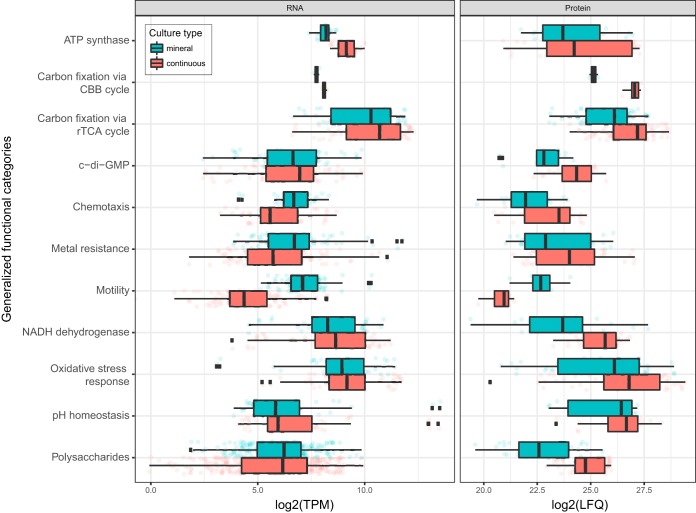
FIG 3.
Overview of gene expression values for RNA-seq (TPM) (left) and proteomics (LFQ) (right) with samples grouped according to culture type. The data represent averages of expression values for genes assigned to selected functional categories (based on data in Data Sets S1 to S3 in the supplemental material), with some categories merged to aid comprehension: nitrogen metabolism (ammonia and glutamate conversion to glutamine, nitrate/nitrite regulation, nitrite uptake and assimilation to ammonia, and nitrogenase genes), metal resistance (resistance to arsenic, cadmium/cobalt/zinc, copper, copper/silver, and mercury plus general metal tolerance), polysaccharides (cellulose production, extracellular polysaccharide production and export, and lipopolysaccharide synthesis), c-di-GMP (c-di-GMP effector proteins, with the EAL domain, proteins with the GGDEF domain, and proteins with both the EAL and GGDEF domains), and pH homeostasis (proton-consuming reactions, proton transporters, and role of potassium in internal positive membrane potential). Note that the average translation values depicted are based on various proteins identified in the corresponding samples. Therefore, assumptions about the up- and downregulation of functional categories of proteins have to be made with caution and only in combination with data from differential translation analysis (Fig. 4 and Data Sets S2 and S3). Abbreviation: CBB, Calvin-Benson-Bassham.

