. 2017 Nov 9;9(1):105–118. doi: 10.1039/c7sc04396a

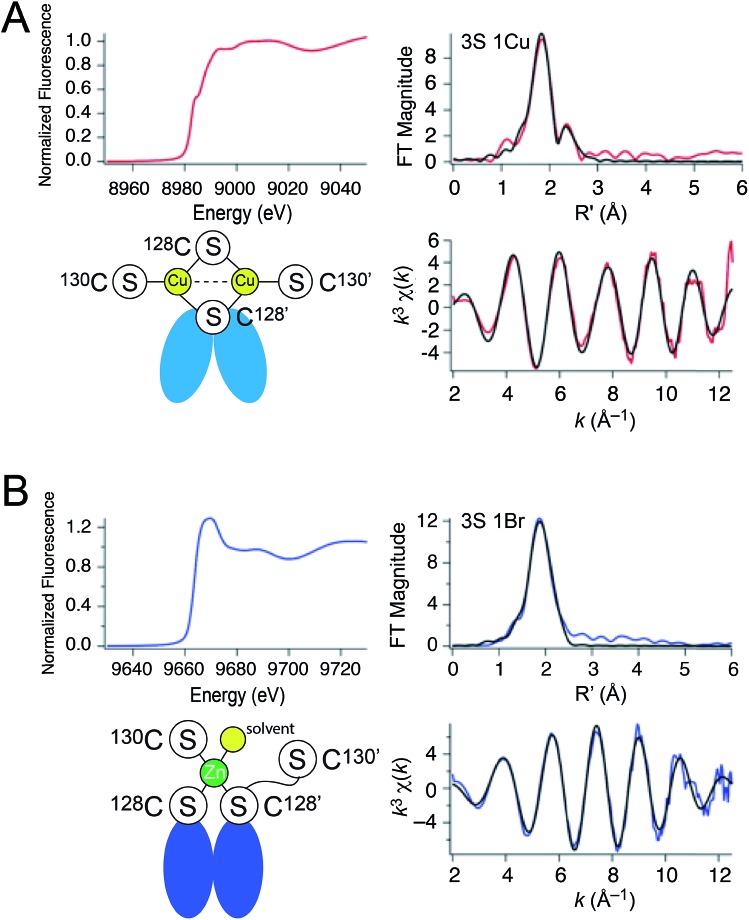
Fig. 3. X-ray absorption spectroscopy of (A) Cu2 CopY in NaCl-containing buffer (Cu2 CopY–Cl) and (B) Zn1 CopY acquired in NaBr-containing buffer (Zn1 CopY–Br) C101A CopY. In each panel the X-ray absorption near-edge spectrum (XANES) is shown in the upper left, the extended X-ray absorption fine structure (EXAFS) and k-space spectra shown in upper right, and lower right, respectively, with cartoon models of each coordination structure consistent with the spectroscopy (red continuous lines in the EXAFS and k-space spectra, respectively; black, best fits to the data) shown in the lower left. The Cu(i) XAS spectra are consistent with the same chemical environment around each of the two bound Cu(i) ions containing 3 Cu–S bonds (d = 2.27 Å) and one Cu–Cu scatterer (d = 2.70 Å), features consistent with the binuclear cluster model shown. The Zn(ii) XAS is consistent with a subunit-bridging cysteine-rich site conforming to a 3S 1H2O tetrahedral complex containing 3 Zn–S bonds (d = 2.29 Å). See Table 1 for a summary of the best fit parameters and Tables S1–S3 for fits for all possible coordination models.

Fig. 3