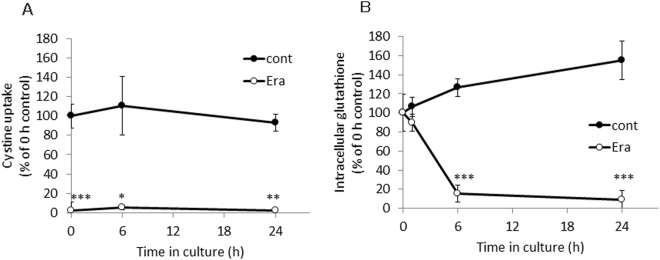
Figure 4.
Time course of the change of the activity of cystine uptake (A) and intracellular glutathione (B) in xCT-overexpressing MEF exposed to erastin for a short time. xCT-overexpressing MEF were cultured for 24 h and subsequently exposed to 100 µM erastin for 5 min. After exposure, cells were washed with 1 mL fresh medium once. Two mL of fresh medium was added (regarded as 0 h) and cells were allowed to grow for 24 h. At the time periods indicated, the uptake of 0.05 mM L-[14C]cystine (A) and/or intracellular glutathione levels (B) were measured. Each point represents the mean of percentages ± S.D. (n = 6 for 0 h control; n = 4 for other points). P values were obtained by unpaired Student’s t test. *P = 1.5 × 10⁻² (control vs erastin at 6 h of cystine uptake), **P = 3 × 10⁻³ (control vs erastin at 24 h of cystine uptake), ***P = 1 × 10⁻⁷ (control vs erastin at 0 h of cystine uptake determination), 5 × 10⁻⁵ (control vs erastin at 6 h of intracellular glutathione determination), 1 × 10⁻⁴ (control vs erastin at 24 h of intracellular glutathione determination).

