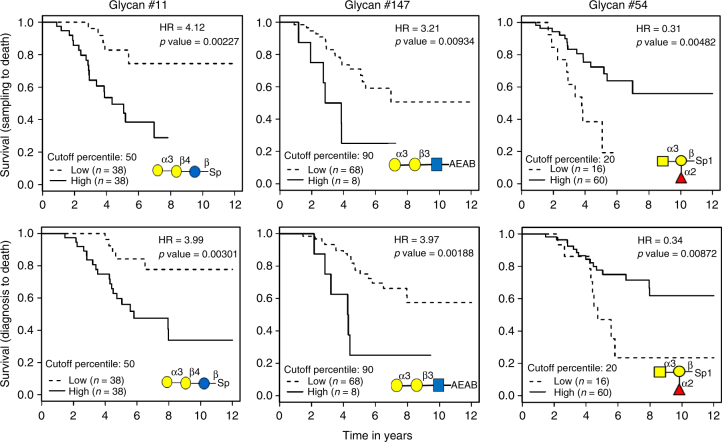
Fig. 6.
Kaplan–Meier survival analyses of ovarian cancer patients. Analysis was done using date of sample collection to death (top row) and date of diagnosis to death (bottom row). The subjects were assigned to the low- (dashed lines) or high- (solid lines) level groups based on the anti-glycan IgG levels for each glycan. The data for three glycans are shown here. The hazards ratio (HR) was determined by Cox regression analysis and the p values were determined using log-rank test

